

3D Modeling of Co-Electrolysis in Solid Oxide Electrolyzers: A Pathway to Carbon-Neutral Fuels
Published on November 03, 2025 · 2 min read
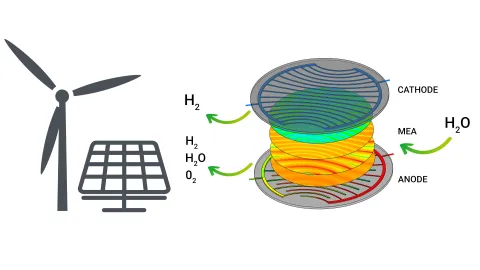
A solid oxide electrolysis cell is a high-temperature electrochemical device that converts electrical energy into chemical energy by reducing steam and carbon dioxide to produce synthesis gas (syngas), a mixture of hydrogen and carbon monoxide. The cell typically operates at temperatures between 700 and 900 °C, where ionic conductivity in the solid oxide electrolyte is high and thermodynamic efficiency is maximized. The cell consists of three functional layers: the cathode, the electrolyte, and the anode.
The cathode, also referred to as the fuel electrode, is usually made of a nickel–yttria-stabilized zirconia (Ni–YSZ) cermet, which provides both electronic conductivity and catalytic activity. At this electrode, the key reduction reactions take place. When a mixture of carbon dioxide, steam, and hydrogen is fed into the cathode channel, the supplied electrical energy drives the electrochemical reduction of both CO₂ and H₂O. The two principal electrochemical reactions occurring on the cathode are the reduction of steam to hydrogen, and the reduction of carbon dioxide to carbon monoxide,
The oxide ions (O²⁻) produced in these reactions are conducted through the dense electrolyte layer, which is typically composed of a thin film of gadolinium-doped ceria (GDC) and yttria-stabilized zirconia (YSZ). The electrolyte is impermeable to gases but allows the selective transport of oxide ions from the cathode to the anode.
At the anode, often made of lanthanum strontium manganite (LSM) or lanthanum strontium cobalt ferrite (LSCF), these oxide ions are oxidized to form molecular oxygen according to
The electrons released in this process are returned through the external circuit to the cathode, completing the electrochemical loop. Air is generally used as the sweep gas on the anode side, resulting in an oxygen-enriched exhaust.
In parallel with the electrochemical reactions, a thermochemical equilibrium reaction known as the water–gas shift reaction (WGSR) occurs within the porous nickel catalyst layer of the cathode. This reaction,
interconverts hydrogen and carbon monoxide and establishes an equilibrium that helps adjust the syngas composition. At the elevated temperatures typical for SOEC operation, the equilibrium shifts toward the production of CO, complementing the electrochemical reduction of CO₂.
The gas mixture entering the cathode typically contains CO₂, H₂O, and a small amount of H₂. The hydrogen serves to maintain a reducing environment that prevents the oxidation of the nickel catalyst. As the gases pass through the porous cathode, CO₂ and H₂O are electrochemically reduced, and together with the equilibrium shift from the WGSR, the outlet gas stream becomes enriched in H₂ and CO. Consequently, the cathode outflow consists mainly of syngas (H₂ + CO) along with residual amounts of H₂O and CO₂, while oxygen is produced on the anode side.
This process combines electrochemical and thermochemical conversions, enabling efficient transformation of electrical and thermal energy into chemical fuels. By adjusting the inlet gas ratios, operating temperature, and current density, the H₂/CO ratio of the produced syngas can be precisely tuned to match downstream synthesis requirements.
Implementation of the Water–Gas Shift Reaction
Within FIRE M, the water–gas shift reaction (WGSR) is implemented directly in the cathode electrode, see Figure 1. This reaction plays a crucial role in determining the local syngas composition and in coupling the chemical and electrochemical subsystems. To reflect experimental conditions accurately, the WGSR parameters can be automatically adapted to experimental measurements, ensuring realistic representation of equilibrium and kinetic effects within the porous Ni-based cathode. This allows users to calibrate the model to specific cell materials, temperatures, and gas compositions, improving the predictive capability of co-electrolysis simulations.

Electrochemical Reaction Modeling
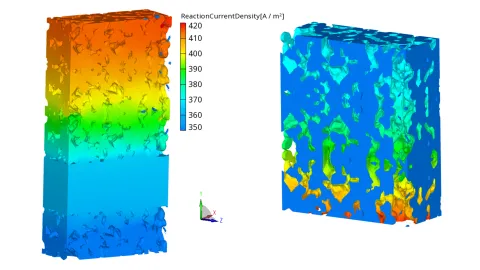
All electrochemical models in FIRE M are formulated as interface reactions between the electrodes and the electrolyte as well as volumetric (3D) reactions distributed within the porous electrodes. This dual approach offers flexibility in representing different physical regimes. For systems where the ionic conductivity within the electrodes is very low, the interface model is typically more appropriate, as the electrochemical activity is confined to the electrode–electrolyte boundary. Conversely, when the electrode exhibits sufficient ionic and electronic conductivity, the 3D volumetric model captures the spatial distribution of electrochemical activity throughout the porous structure, providing a more realistic description of current density and potential fields, see Figure 2.

Introduction of a 3D Reaction Zone
Based on insights from micro-simulation studies, which demonstrated that a volumetric approach is essential for realistically capturing the behavior of electrochemical reactions in porous electrodes in addition to the interface approach a volumetric reaction zone was introduced.
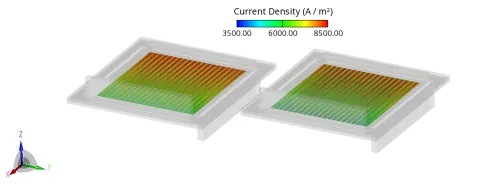
The decision to extend the reaction zone from 2D to 3D was guided by microstructural simulation work carried out in the FFG project “Design-SOEC” together with Montanuniversity Leoben and the Material Center Leoben. In this project, 3D microstructural data of the air electrode were obtained from the Material Center Leoben. The 3D morphology was reconstructed from FESEM (Field Emission Scanning Electron Microscopy) images using AI-based image processing. From this reconstructed microstructure, a representative 3D slice of a button cell was created, with the air electrode fully resolved in three dimensions, see Figure 3.
The FIRE M framework was then extended to simulate this microstructural slice. This effort confirmed that local reaction rates and current distributions cannot be accurately represented by purely 2D models—especially in heterogeneous electrodes with varying porosity and tortuosity. Consequently, the new 3D reaction zone implementation includes ionic conductivity in porous solids and a volumetric exchange current density, allowing FIRE M to simulate 3D ionic transport and to capture the spatial distribution of reaction sites throughout the electrochemical active layer. With this extension we observed a better approximation of the measured VI-curve for a button cell, see Figure 4.

Coupled Maxwell–Stefan and Knudsen Diffusion
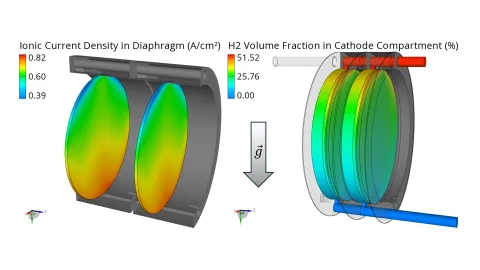
Accurate prediction of gas transport in porous electrodes is critical for SOEC modeling. FIRE M includes a detailed multicomponent diffusion formulation that consistently combines Maxwell–Stefan diffusion with Knudsen diffusion effects. This development was particularly challenging because it required deriving a consistent mathematical framework that simultaneously accounts for molecular diffusion, species interaction, and pore-scale confinement effects. The resulting implementation allows FIRE M to represent gas transport accurately even in electrodes with very fine pores, where Knudsen effects become significant and can strongly influence local reaction rates and species gradients, see Figure 5.
FIRE M brings together CO₂ + H₂O co-electrolysis, combining electrochemical reduction of steam and carbon dioxide with the water–gas shift reaction inside the porous nickel-based electrode. With advanced 3D reaction zone modeling, volumetric electrochemical kinetics, and multicomponent + Knudsen diffusion, FIRE M delivers next-level accuracy for syngas composition and process simulation.
Stay tuned
Don't miss the Simulation blog series. Sign up today and stay informed!
Read More About This Topic

Electrolyzers – the technology at the heart of green hydrogen production – are currently in the focus of intense research and innovation activities, aiming at increased efficiency, minimized performance loss over time, and reducing development effort and time to market.
The alkaline electrolyzer is the most mature technology for water electrolyzers with a history of more than 200 years. As a reaction to the significance of that technology in the market, AVL FIRE™ M offers an electrochemical multiphase model for the simulation of alkaline electrolyzers with the release 2024 R2.
The demand for sustainably generated energy is increasing rapidly, and electrolyzers are seen as a promising technology. Due to their efficiency and good dynamic performance, PEM electrolyzers are one of the most widely used technologies today.
Stay tuned for the Simulation Blog
Don't miss the Simulation blog series. Sign up today and stay informed!