

3D Simulation of a PEM Fuel Cell Air Start-Up Scenario Including Degradation
Published on December 17, 2025 · 10 min read
Depending on the prior shut-down procedure, the ambient pressure conditions and the quality of the sealings, it can require several hours to days until the anode compartment is completely filled with air. That poses a problem during subsequent start-up: Carbon corrosion is triggered, which causes catalyst layer thinning and platinum particle detachment – see Figure 1. Thus, cell performance and lifetime are reduced. Details of the underlying process during this air (or air/air) start-up are illuminated in the next section.
![Carbon corrosion of the cathode catalyst layer (upper white stripe): begin of life (left); end of life (right) [1].](/sites/default/files/styles/original_small/public/2025-12/figure1_fuel-cell-startup.png.webp?itok=cvOwZy9B)
We assume the anode compartment is completely filled with air. As soon as the fuel cell is started again, hydrogen begins to flow into the anode channels. Due to the existing air in the anode channels, a hydrogen/air front starts to develop. This has the following consequences – see also Figure 2: A hydrogen oxidation reaction (HOR) starts close to the anode inlet. The produced electrons close to the H2/O2 front do not travel, as usual, along an outer load circuit, but, instead, trigger an oxygen reduction reaction (ORR) in the nearby oxygen where they are consumed.
Since beside electrons also hydrogen protons are consumed in the generated ORR, the internal cell current changes direction: Protons are now transported in the ‘wrong’ direction, i.e. from cathode to anode. This causes the cathode potential to increase to huge values (> 1.5 V) triggering severe carbon corrosion, i.e. carbon oxidation reaction (COR), of the cathode catalyst layer. At such large potentials it is also possible that oxygen is produced in an oxygen evolution reaction (OER) as it usually happens in electrolyzers. As can be seen in Figure 2, the cell is now divided into an active part producing electricity (left) and a passive part consuming electricity (right). While the start-up proceeds, the passive part is replaced with the active part.
![Figure 2: Mechanism of reverse-current decay during an air start-up [2].](/sites/default/files/styles/original_small/public/2025-12/figure2_fuel-cell-startup.png.webp?itok=odvZV6q6)
Beside the mentioned reactions, the following mechanisms take place simultaneously:
- Platinum oxidation: At the occurring potentials, platinum oxidation plays a major role at both cathode and anode. It has an important effect on the local currents and voltages by acting as a pseudo-capacitive resistance.
- Double layer capacitance: Another important capacitive effect results from the charge/discharge of the electrochemical double layer which also takes place at both cathode and anode.
A similar scenario can take place during the shut-down of a PEM fuel cell.
All reactions mentioned in the previous section take place within the anode or cathode catalyst layer. Therefore, it is important to resolve the catalyst layers locally, as it is usually done in AVL FIRE™ M. Figure 3 shows a typical discretization of the catalyst layers and the membrane, i.e. a part of the computational mesh, together with the solved reaction equations and transport across the membrane.
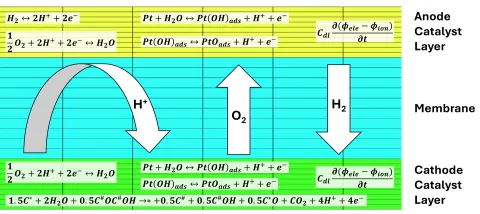
The reactions produce local mass, heat and current sources, thus modifying locally the gas species fractions, temperature and potential. In the membrane, the protonic current is determined by the current sources in the catalyst layers resulting in a 3D ionic potential distribution. Gas species are also transported across the membrane, e.g. the hydrogen concentration at the anode is additionally influenced by the hydrogen crossover from anode to cathode. The species transport from the channels across the gas diffusion layers to the catalyst layers takes place as usual. An important difference to a ‘standard’ fuel cell simulation is the highly dynamic process in contrast to the steady state condition which is usually of interest. In that context it is important that each time step converges with sufficient accuracy and that the used time step size fits the problem. The latter can be achieved by applying an adaptive time step size.
A comparison to real life data is indispensable when it comes to the assessment of the accuracy of mathematical models. A common problem in the validation of electrochemical models for fuel cells and electrolyzers is the scarce availability of measurement data. Most of the calculated result quantities simply cannot be measured. Therefore, it is often necessary to rely on global quantities, such as current, voltage or temperature. Every reaction involved in the air start-up produces an electric current which affects the local voltage. Figure 4 shows the different current contributions on cathode and anode side in the segments of a straight channel cell.
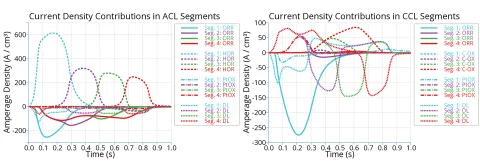
The sum of those currents and the resulting local voltage can be compared to measurement data. Figure 5 shows the local voltage in cathode and anode as well as the current density in simulation and measurement [3] within four segments, where segment 1 and 4 are located at the anode inlet and outlet, respectively. Although the agreement is not perfect, the important trends can be predicted by the simulation:
- The maximum local voltage occurs at the cathode with a value of approx. 1.6 V.
- The overall start-up time is approx 1 s.
- The highest cathode potential occurs at segment 4, i.e. close to the anode outlet.
Segment 1 shows the highest negative current density (working direction: protons from anode to cathode) and segment 4 the highest positive current density (reverse direction: protons from cathode to anode).
The high cathode potential at the anode outlet enhances the local carbon corrosion rate as will be shown in the next section.
![Figure 5: Local voltage in cathode and anode (top) and current density (bottom) in simulation (left) and experiment [3] (right); the results are shown in four segments along the anode channel.](/sites/default/files/styles/original_small/public/2025-12/figure5_fuel-cell-startup.png.webp?itok=UzGhMnYY)
The application of the model to an industrial PEM fuel cell gives an interesting insight into the local behavior during the start-up phase. Figure 6 shows the transport of hydrogen and oxygen through the anode channels and the anode catalyst layer. The replacement of oxygen with hydrogen is completed after approx. 3 seconds.

Figure 7 shows the HOR and ORR current densities in the anode catalyst layer during the first 2 seconds after start of hydrogen injection. The reaction rates peak at the location of the H2/O2 front. The front is located below the outermost channels due to the enhanced H2 and O2 transport in the GDL resulting from the large pressure gradient between neighbored channels.

Finally, local voltage and carbon corrosion rate in the cathode catalyst layer during the first 3 seconds are shown in Figure 8. As the H2/O2 front progresses through the cell, the local cathode voltage increases. The region near the anode outlet is exposed to O2 for a long time. Therefore, the local voltage increases to large values near the anode outlet leading to a high local carbon corrosion rate.

With the Release 2025 R2 of FIRE M a realistic air start-up scenario of a PEM fuel cell can be simulated. During the start-up, parasitic redox reactions, platinum oxidation, carbon corrosion and double layer capacitance play a major role. The resulting local currents and voltages are comparable to measurement data. The most critical location is the anode outlet where the local cathode potential reaches very high values resulting in severe carbon corrosion. 3D results can be used to analyze the local behavior during the transient process. The transient 3D simulation enables, among other things, the analysis of the progression of the hydrogen/oxygen front and the location and starting point of the resulting carbon corrosion rate. With the help of such results, geometry and operating conditions can be optimized with the objective of minimizing degradation during the start-up phase.
[1] G. M. Carrabba et al., Int. J. Hydrogen Energy 133, 546, 2025.
[2] R. B. Kaspar et al., J. Electrochem. Soc. 163, F377, 2016.
[3] E. Colombo et al., J. Electrochem. Soc. 168, 054508, 2021.
Stay tuned
Don't miss the Simulation blog series. Sign up today and stay informed!
Read More About This Topic

As PEM fuel cells move to the forefront of heavy-duty transportation and aviation, development teams are under growing pressure to deliver systems that meet ambitious performance, durability, and efficiency targets.

SIMpulse stands for innovative insight into the ever-evolving landscape of simulation technology. Experience a dynamic showcase spotlighting the diverse facets of simulation applications, from automotive design to energy optimization and beyond.

How simulation reveals the physics of mobile hydrogen refueling and helps optimize efficiency, safety, and speed.
Stay tuned for the Simulation Blog
Don't miss the Simulation blog series. Sign up today and stay informed!