Discover Particle Behaviors With the New Pathlines Feature in AVL IMPRESS™ M
Published on July 22, 2025 · 7 min read

In this article we demonstrate pathlines in a cyclone separator with a diameter of 20 cm and a height of about 50 cm. This type of device is typically used to separate particles or droplets from a gas stream using centrifugal force. Common applications include:
- Dust collection in woodworking or metalworking
- Pre-filtration in vacuum or air filtration systems
- Solid-gas separation in chemical or pharmaceutical processes
In the showcase we separate dust metal particles with mass flow of around 10g/second as it can appear in metalworking.
To utilize pathlines, simply activate the Spray module in the AVL FIRE™ M Home tab and ensure that the output frequency of 3D results is sufficiently high to capture transient particle motion. In addition to basic particle data, pathlines can be enriched with cell-based variables and quantities from the Eulerian phase. When these fields are included in the output, they can be used to color both particles and pathlines, enabling more detailed visualization and analysis of flow characteristics.
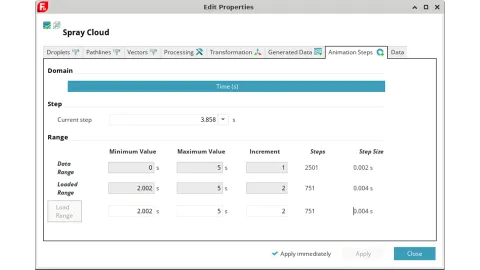
To display pathlines, navigate to the Results tab and create a Spray Cloud object. New in release 2025 R1, the spray cloud properties now allow you to specify which time steps of spray data to load, as illustrated in Figure 1.
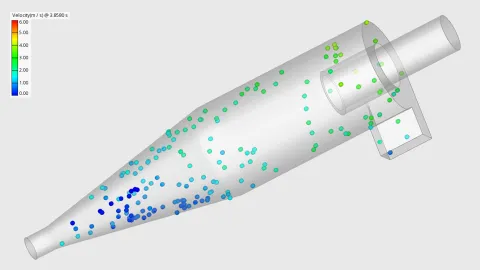
As an example, magnitude of particle velocity can be assigned to color, while the particle count can be limited to 200 using the controls in Processing/Mask to reduce visual clutter. The resulting visualization can be seen in Figure 2.
A limitation of conventional particle visualization quickly becomes apparent: while particle positions at a given time step are clearly shown, their trajectories over time remain obscured. Even the animation in Figure 3 provides only very limited insight into the underlying flow patterns.
Figure 3: Particles in Cyclone Separator
The new pathlines feature in 2025 R1 addresses this challenge by revealing the full motion history of particles within the flow field.
Pathlines can be enabled in the properties of Spray Cloud objects via the dedicated Pathlines tab. To maintain clarity in complex scenes, it is advisable to limit the number of displayed particles and pathlines using the settings in Processing/Mask. By default, AVL IMPRESS™ M displays full trajectories over the entire simulation duration. Pathline thickness can be adjusted using the Glyph size range control, and coloring can be applied based on any available results quantity through the settings in Pathlines/Color Mapping.
Figure 4 presents an example of this visualization. While it already reveals valuable information about particle trajectories, further refinement can enhance its interpretability.
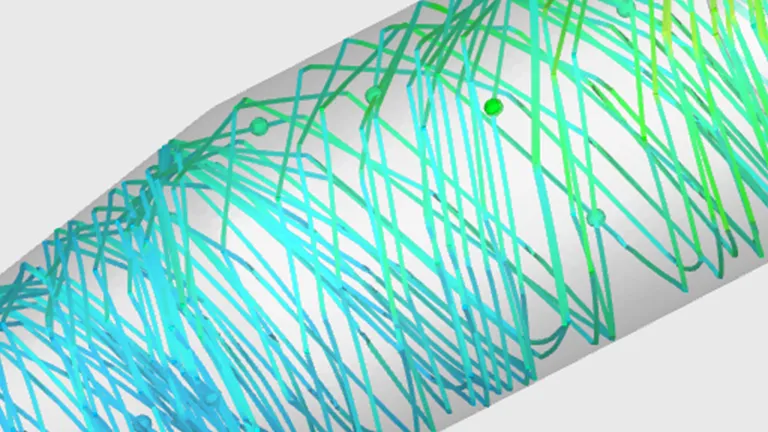
To control which portion of the particle trajectory is displayed, navigate to the Pathlines/Traces tab. A particularly powerful option is Grow, which displays the particle paths from their injection point up to the current animation step, as set in the animation controls on the ribbon. When played over time, the pathlines appear to grow, dynamically revealing particle motion as it evolves—an effective method for illustrating transient behavior. In Figure 5 it becomes clearly visible how particles bounce back from the wall of the cyclone separator.
Figure 5: Using the Grow option reveals the complete trajectories of particles, as they bounce back from the inside wall of the cyclone separator.
Another valuable option is Trace, which renders trajectories from the current time step along with a configurable number of previous steps, defined by the Length parameter. Because the pathlines feature extends the existing particle visualization system, both particles and pathlines can be displayed concurrently. Figure 6 demonstrates that Trace becomes a powerful tool for conveying particle direction and recent path history.
Figure 6: The Trace option retains motion history and reduces visual clutter, too.
Further insight can be gained by enabling velocity vectors at each particle, using the controls available on the Vectors tab. Vectors, particles, and pathlines together allow engineers to communicate complex flow data clearly within a single image or video. Figure 7 showcases such an animation.
Figure 7: Adding arrow glyphs to indicate particle velocity.
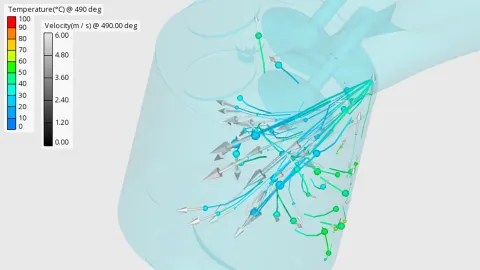
The application possibilities of pathlines extend to other models. Figure 8 captures a snapshot from a gasoline direct injection (GDI) engine simulation, enhanced with arrows representing droplet velocity. Vectors, particles, and pathlines can each be independently colored by different result quantities. This visualization conveys comprehensive information about droplet locations, instantaneous velocities, and the recent trajectories traveled, providing a detailed view of spray dynamics within the combustion chamber.
The new pathlines feature in IMPRESS M 2025 R1 significantly enhances the visualization of transient particle motion by revealing full or partial trajectories over time. With flexible options for coloring and animation, pathlines offer deeper insight into spray dynamics and complex flow behavior—empowering engineers to make more informed design and analysis decisions.
Stay tuned
Don't miss the Simulation blog series. Sign up today and stay informed!
Stay tuned for the Simulation Blog
Don't miss the Simulation blog series. Sign up today and stay informed!