Harness the power of your data by using AVL PULSE to collect, visualize, and analyze your data in real-time from a PC or even your phone. With user-friendly features like KPI dashboards and smart alerts, your team can identify anomalies, minimize downtime, and improve traceability. Ultimately, PULSE allows users to leverage operational data to improve the efficiency of their team and testing facility.
Data Management
>1TB of data is collected daily at a typical lab. PULSE helps distinguish operational data from measurement data for analysis.
People & Processes
Operating a complex system of devices, people, and processes is a monumental task. Identify inefficiencies instead of relying on instincts.
Traceability
Data without context is arbitrary. PULSE tracks metadata to help maximize insights.
Stay Informed
Users are informed via email or SMS when test cells are not performing with a configured escalation path.
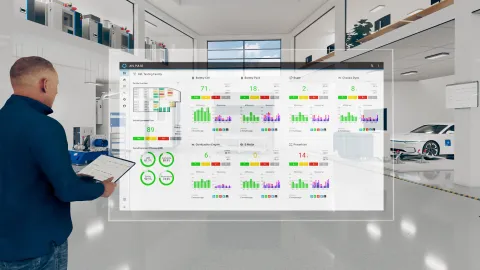
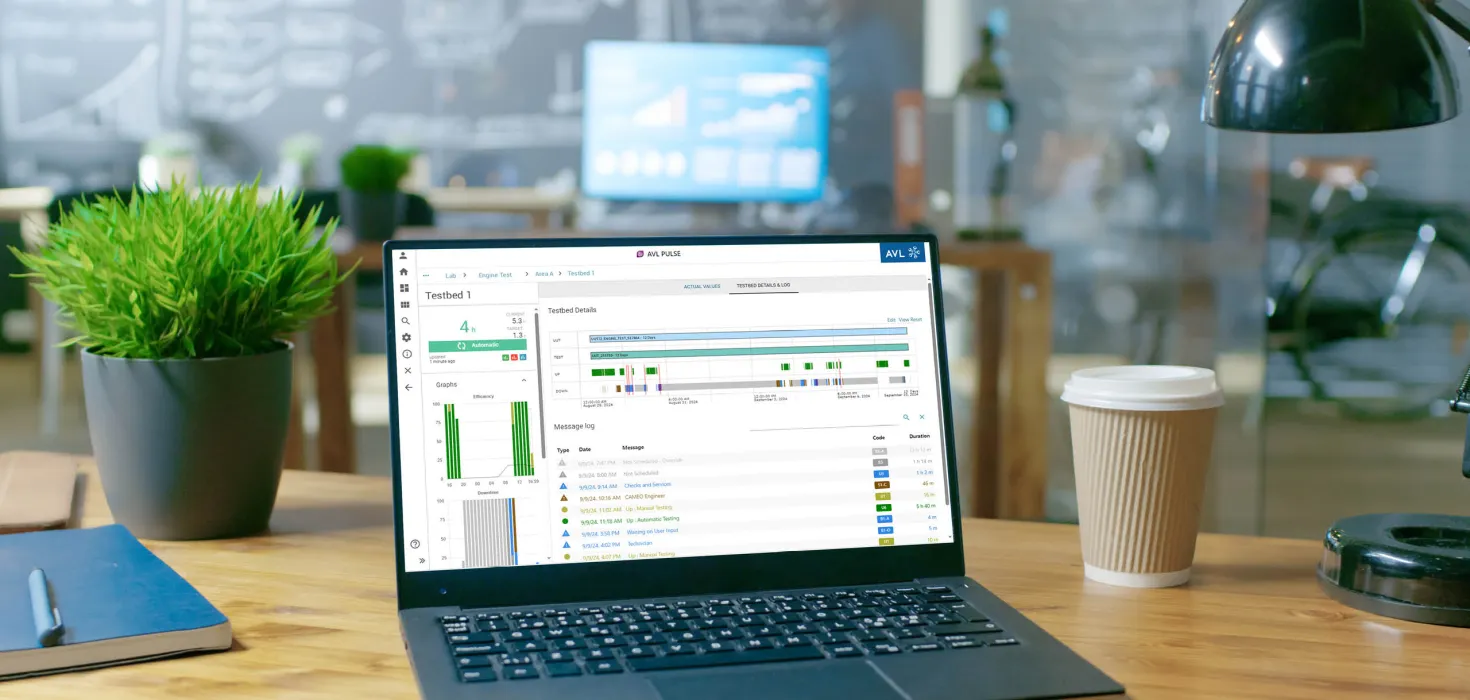
AVL PULSE collects real-time data from testbeds across your organization and presents it in a configurable user interface. As a user, gain a clear overview of current operations, test execution statuses, and historical trends.
By configuring reason code, users define escalation paths for events, status changes, or anomalies. Stakeholders are informed in real-time when a test cell is not performing. Supervisors are alerted of unresolved issues to identify and address limitations related to personnel, processes, or equipment.
Furthermore, data can be mined through public Application Programming Interfaces (API) like Power BI for deeper analysis and visualization.
Scalable for Your Needs
Scalable solution from small lab to full enterprises
Illustrate Your Efficiency
Visualize the efficiency of your lab without additional effort
Customization At Your Fingertips
Customizable to fit your organization and testing facility’s specific needs
Customization At Your Fingertips
Customizable to fit your organization and testing facility’s specific needs
Regular Updates
Stay informed of lab performance with hourly summary notifications including performance updates and reason codes
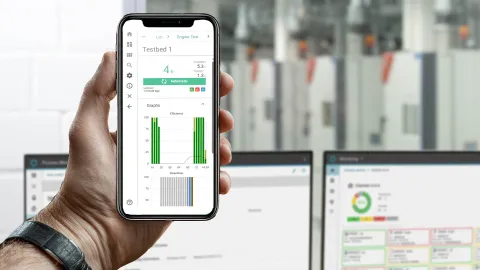
Instant Access
Access PULSE on your smart phone, tablet, or mobile device
Easy Integration
Integrate with your existing test automation system or AVL systems such as iGEM, PUMA, LYNX
Detailed View of Your Lab
Monitor and display the status of your test equipment and automation and systems through existing API including, building automation system, HVAC, and lab temperature management
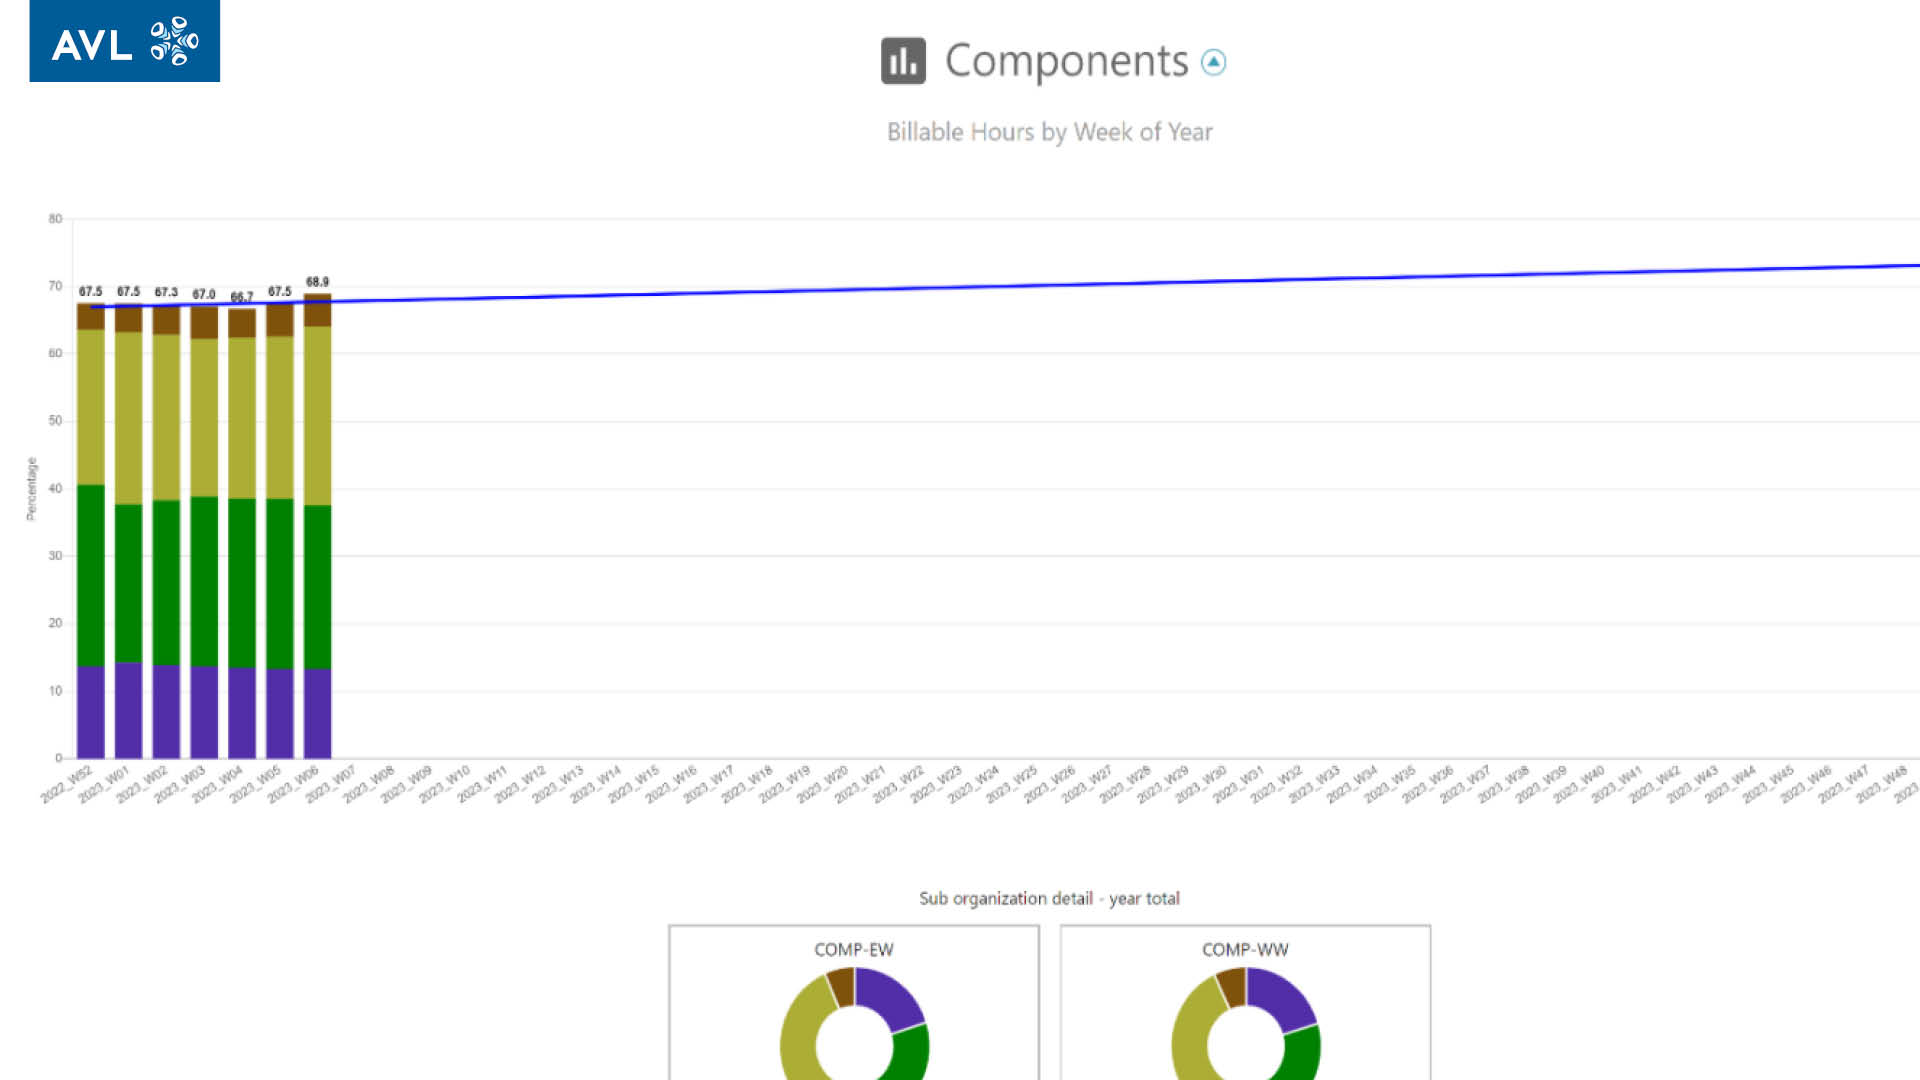
View trends and patterns
Users can model and view an entire organization then drilldown from a certain lab to a single testbed
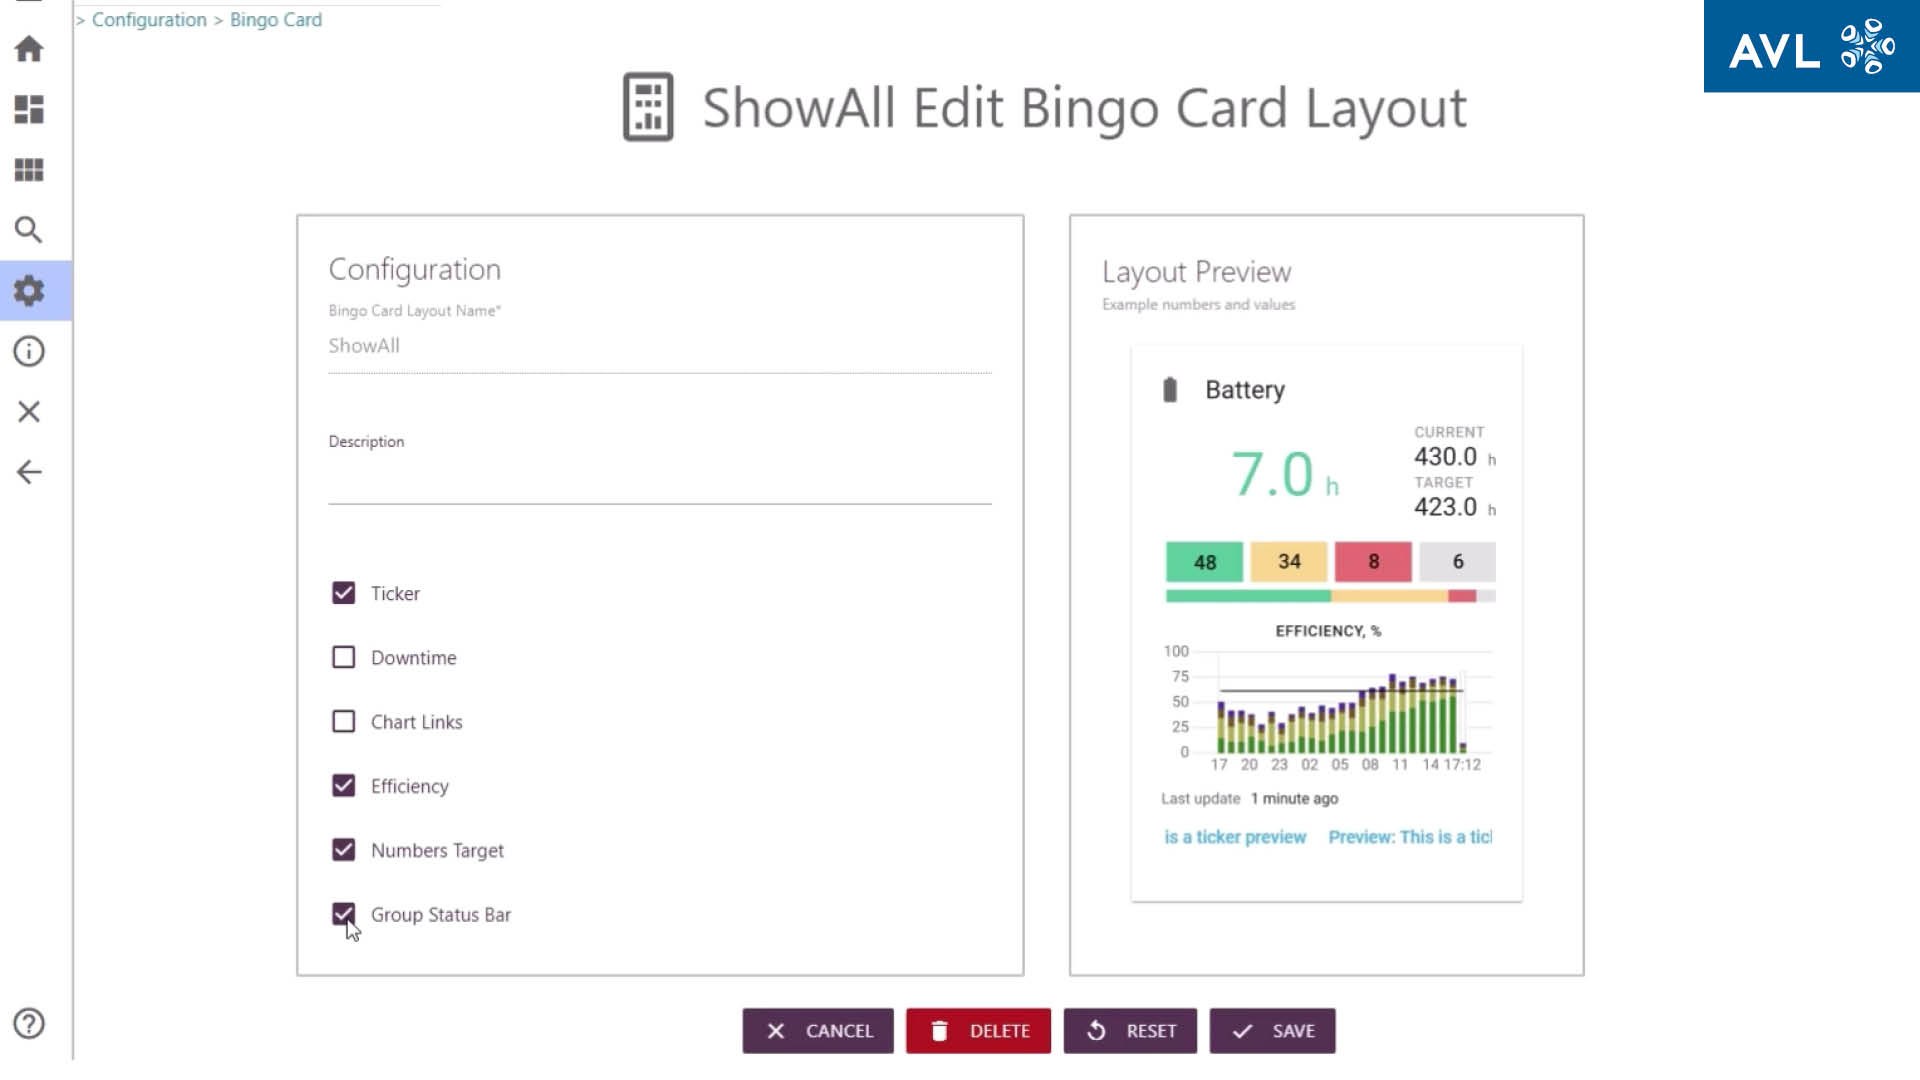
KPI Dashboard
Track trends and lab utilization with a comprehensive dashboard that features live and historical data.
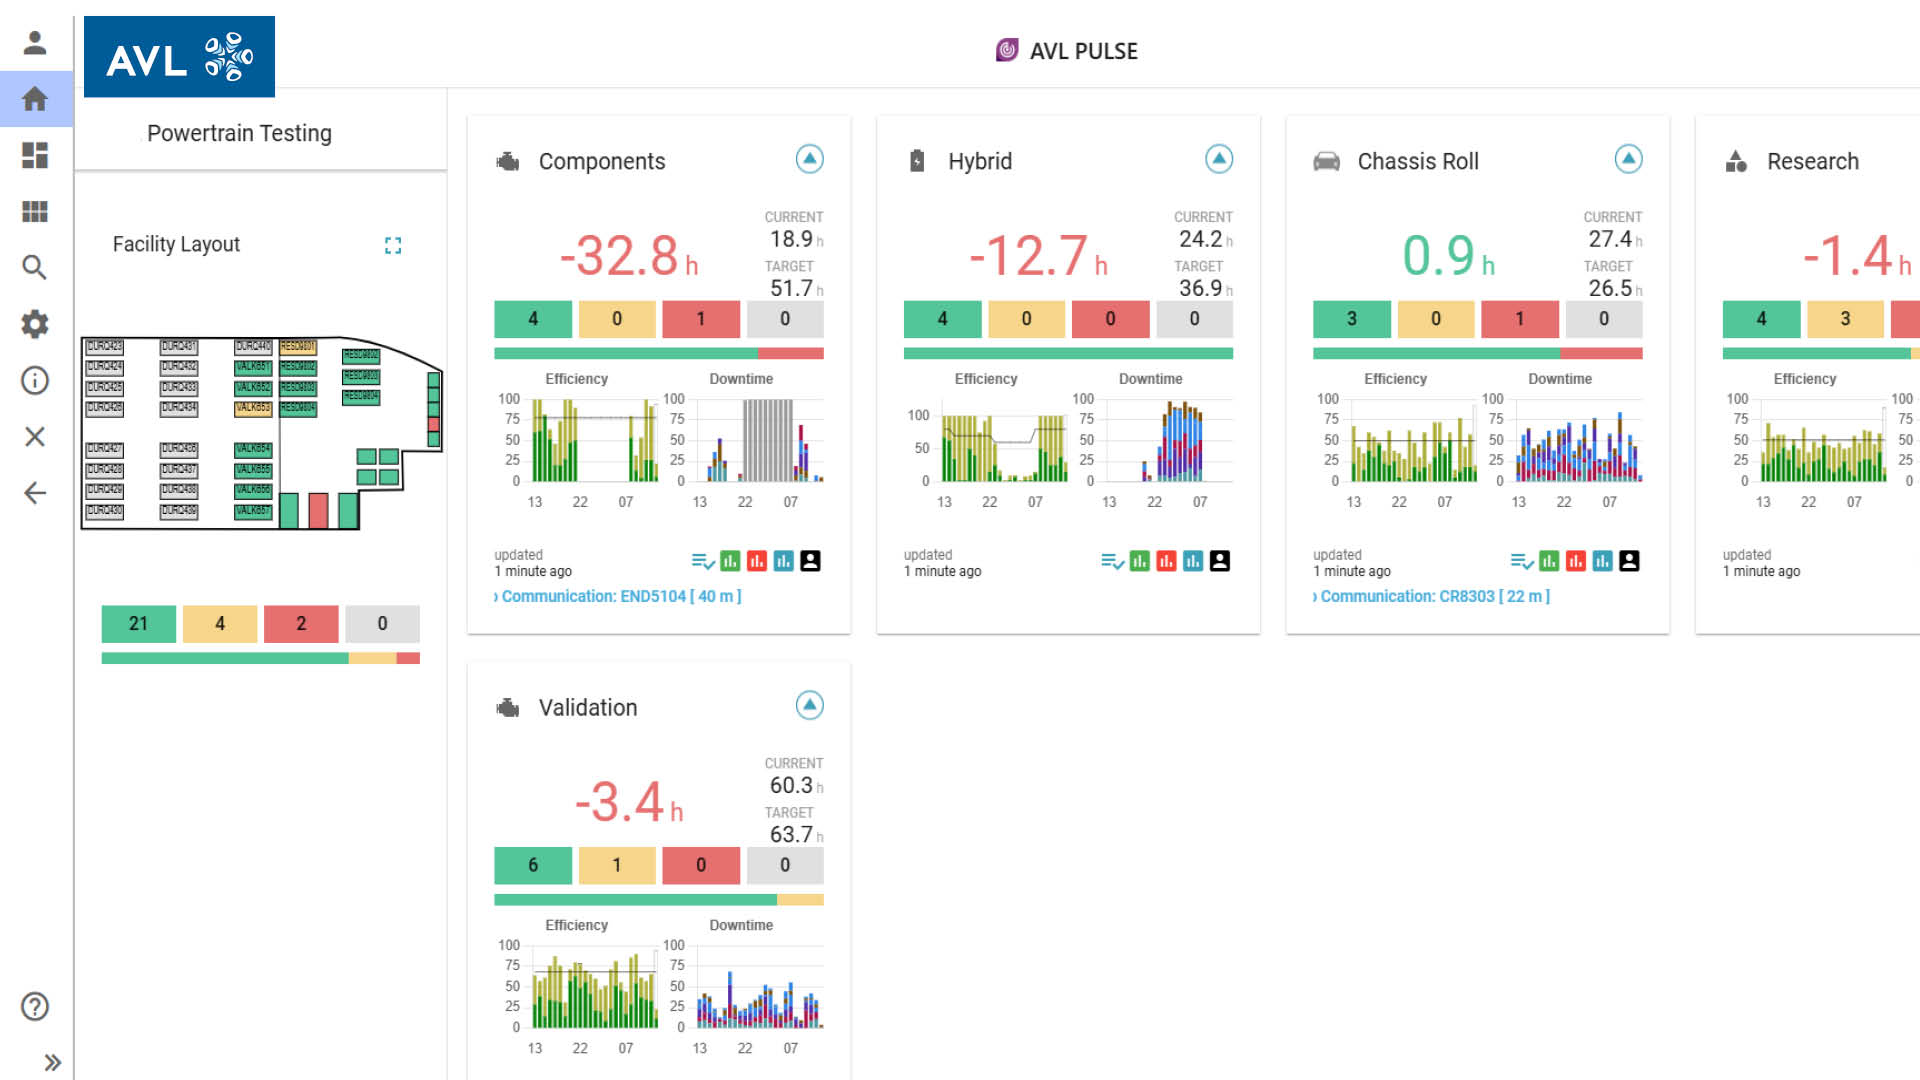
Configurable User Interface
Tailor your dashboard and view to display the information most relevant to your testing and management team.
Billing Report
Track activities and aggregate the associated costs which help your customers understand how costs are allocated.

At the end of the day, AVL PULSE helps teams make smarter decisions, faster. It takes the guesswork and emotion out of lab operations by turning raw data into clear, actionable insights. Instead of relying on opinions, engineers get real-time visibility and automated tracking they can trust."
– Eugene Mondrusov, Global Product Manager
AVL PULSE can be integrated with other data management and test automation tools for further insight into test data and lab managment.

AVL Data Analytics™ is a cloud-first software solution built for the needs of today's automotive engineers, driving powerful data insights and effective actions at scale.

Explore the tools and features that make AVL LYNX™ the heart of your lab.

AVL iGEM 2™ is our cutting-edge test automation solution for your energy and emission testing needs. It delivers high-quality data for certification and R&D testing.

- EN,
AVL CONCERTO 5™ is the extendable platform to master the needs in data processing for the development of new and innovative vehicle concepts.
Meet the challenges of today and tomorrow with this modular data management solution for data harmonization, integration, search, exploration, and automated processing.

During this webinar will give you an overview of the leading automation system AVL PUMA 2™ demonstrating the most important software and hardware benefits and functionalities.