AVL Simulation Software Release 2026 R1
Published on June 08, 2026 · 34 min read


Vehicle Systems
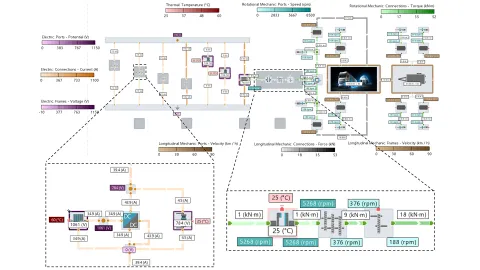
Model Flow Diagram – Assessment of States and Fluxes
Multi-physical system simulation deals with the transport and conversion of energy in plants composed of components from gas, liquid, electrical and other domains. AVL CRUISE™ M facilitates the analysis of complex power flow networks with Model Flow Diagrams (MFD). With this version, MFD additionally provides information on states and fluxes. Component states like temperature are visualized as colored frames, port states like speed are visualized via labels and fluxes like mass flow are displayed by colored connection lines of scalable width. AVL IMPRESS™ M provides comprehensive customization options for your MFD, including configuration of color schemes, value ranges, units and visibility of domains, connections, ports and frames.
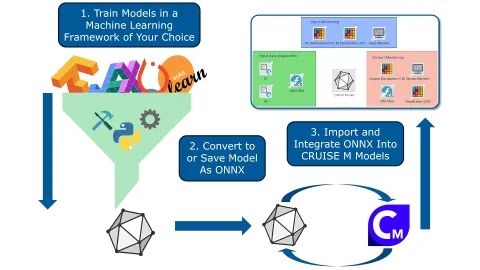
Neural Network Evaluator – Import of ONNX
Data-driven models can be a powerful extension to physical models. CRUISE M addresses this with built-in matrix operations in the Compiled Function component to efficiently implement custom neural network evaluators. With this version, CRUISE M offers a more generalized approach to the integration of machine learning models through a new ONNX component based on the Open Neural Network eXchange (ONNX) standard. Eliminating the need for coding or manual configuration of a Compiled Function, the ONNX component allows you to directly import machine learning models via ONNX files. Pull the ONNX component from the library and load an ONNX file that might have been trained in sklearn, PyTorch, MATLAB, TensorFlow or any other ONNX-compatible tool. CRUISE M identifies the number and kind of input/output channels to be connected to other components of your system model. When starting a simulation, CRUISE M interprets the given AI model structure and evaluates it accordingly.
Battery Systems
Electrochemical Battery – LMFP Model
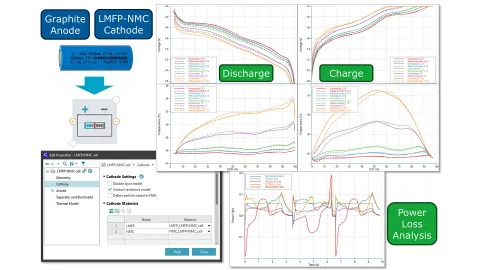
Modern lithium-ion batteries often feature blends of different electrode materials to take advantage of individual material characteristics on energy density, safety and durability. CRUISE M’s electrochemical battery allows you to simulate such blends with a unique heterogeneous electrode approach.
With this version, the performance of the heterogeneous model is demonstrated on the example of a commercial 26700 cylindrical cell with an LMFP/NMC blended cathode. The heterogeneous model, which treats both materials separately, and the homogenized model, which features a single effective cathode material, are parameterized on experimental data.
The advantages of the heterogeneous approach become apparent at low temperature and/or high loads due to the sluggish LMFP diffusion and the rapid decline in NMC kinetics with decreasing temperature. Allowing material-dependent depth of discharge is essential for understanding temperature-dependent capacity reduction caused by diffusion limitations.
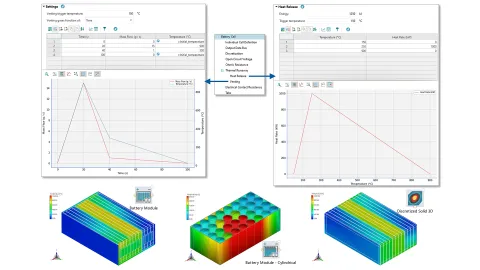
Battery Modules – Venting Gas Formation
Simulation plays a vital role in assessing thermal runaway propagation (TRP). It allows you to save time and cost for demanding experimental campaigns. CRUISE M’s Battery Module and Discretized Solid 3D components are tailored to efficiently assess TRP using meshing-free 3D models of configurable cell assemblies and cooling designs. With this version, modeling of venting gases is additionally taken into consideration. When opening one of these components, you can opt for an input page on thermal runaway/venting. With that, you can populate tables on venting gas mass flow and temperature either as a function of time or local solid/cell temperature.
Fuel Cell & Electrolyzer Systems
Fuel Cell and Electrolyzer Stack – Speedup
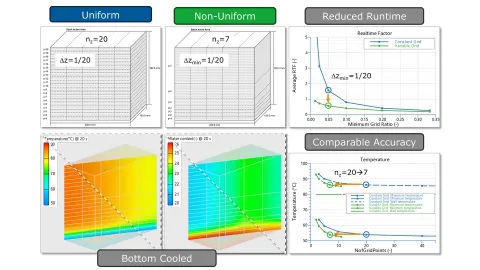
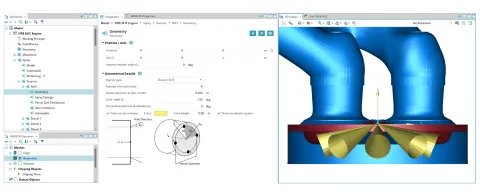
The stack models of the PEM Fuel Cell, PEM Electrolyzer and SOxC component offer the option to describe the stack behavior in 3D. You can configure the spatial resolution in all three dimensions, select between straight or serpentine gas channels and choose between parallel or crossflow as flow type.
With this version, you can additionally configure a non-uniform discretization over the height cell stack. Depending on a-priori knowledge of the cooling (e.g. bottom cooling) or inflow conditions (e.g. given by CFD), you can apply a denser mesh near the stack bottom and a coarser mesh for the remaining stack height. The benefit of a non-uniform mesh is improved computational efficiency. Because simulation time roughly scales with the number of computational cells, depending on your accuracy goals, you can achieve speedups of up to one order of magnitude.
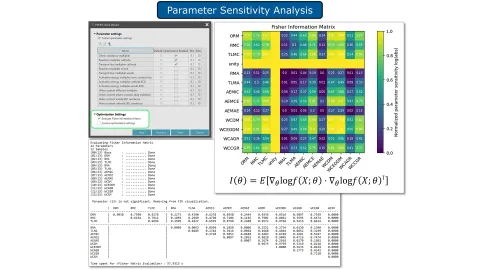
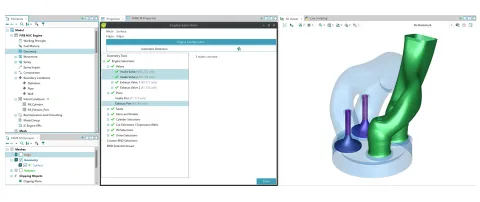
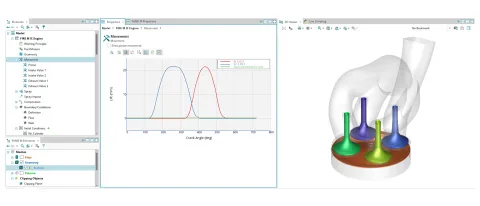
Fuel Cell and Electrolyzer Wizards – Parameter Sensitivity
Model parameterization can be challenging. CRUISE M addresses this with parameterization wizards, such as those for the PEM Fuel Cell and Electrolyzer Stack components. The wizards ask for reference data and which parameters should be identified. Each offers more than ten parameters, although not all are required for every application. This version of CRUISE M facilitates this choice with the help of the Fisher Information Matrix. You can optionally generate a heat map showing the sensitivity of the parameters. Large diagonal values imply that small changes in the parameters lead to significant changes in the response, making the parameters easier to estimate accurately, whereas low diagonal values indicate that the corresponding parameter may be replaced by a constant.
Thermodynamics & Exhaust Aftertreatment Systems
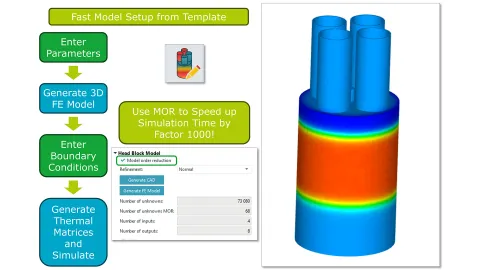
Head Block Component – Thermal Assessment in 3D
Engine warmup runs are determined by the heat released in the combustion chambers, the heat dissipated into the cooling circuits and the inertia of the engine block. The application of 0D lumped mass networks to model the solid structure is computationally efficient but suffers from accuracy and ease of parameterization. To overcome these deficiencies, CRUISE M offers a new Head Block component that resolves the temperature distribution in the liner, head, valve, etc. in full 3D.
When you pull the component from the library, you first create a 3D head block object from a handful of geometrical inputs, followed by a complete Finite Element (FE) model that incorporates your selection of boundary conditions. Any flux boundary is ready to be connected to CRUISE M’s heat and cooling flow networks. CRUISE M solves the FE model and returns all results in 3D. If you are focused on the pure input/output behavior of the Head Block component, a “Model Order Reduction” option is available. This typically provides a speedup of 1000 while preserving the accuracy of the full FE model.
1D-3D Thermodynamic Simulation – Right-Sized Modeling Depth
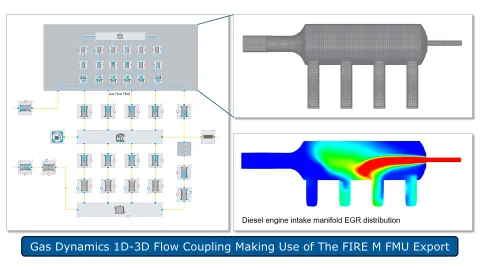
1D gas dynamic models successfully describe the gas exchange of combustion engines. However, 1D approaches suffer from accurately resolving 3D effects like the distribution of EGR in intake manifolds or wave dynamics in air boxes of race engines. This version of CRUISE M and AVL FIRE™ M enables the combination of both 1D and 3D resolutions in one common model. A workflow guides you through the preparation of the 1D and 3D models requiring interface definitions, wrapping the 3D model into an FMU and loading this FMU in CRUISE M. There are two new CRUISE M components, Gas Flow Interface and Gas Flow FMU, that facilitate the setup and allow the configuration of a co-simulation strategy. Beyond the FMI standard, you can define isolated 1D and 3D simulation periods to stabilize the domains individually before closing the link to a fully coupled co-simulation.
CAD Import – Automated Creation of Manifold Models
Modeling of engine thermodynamics is closely linked to the geometrical design of intake and exhaust manifolds. Any design change potentially influences cylinder charge and performance and thus calls for a recheck by thermodynamic simulations. With this version of CRUISE M, the link between design and simulation is tightened by a new CAD import functionality. The existing CAD Importer, tailored for liquid flow systems, is extended to support the needs of manifolds. When launching the CAD Importer, you are guided to SHAPE, a tool designed to process CAD data. There, you can load your CAD, select the “Stage Manifold” option, prepare inlet and outlet ports and start an automated analysis process. When completed, you get feedback directly in your CAD through highlighted centerlines along all pipes and highlighted junction branches. Clicking “Import Staged” brings you back to CRUISE M, where the CAD-derived pipe and junction network is packed into a subsystem, ready to be connected to your thermodynamic model.

CAD Import – Model Derivation from Native CAD Data
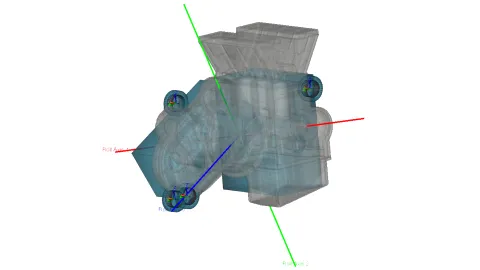
The CAD Import feature enables the direct creation of AVL EXCITE™ M bodies and subcomponents from common native CAD formats. Body coordinate systems, as well as the position, orientation and parametric geometry of subcomponents, can be derived from the CAD data, drastically reducing the time it takes to create a model by eliminating redundant manual definition of parametric geometry in CAD and in EXCITE M. An overlapped visualization of the CAD model and the generated EXCITE M model allows you to verify correctness and alignment of the imported data.

The functionality supports both the creation of complete models and the selective import of individual parts from CAD. In EXCITE M you also have access to the full set of functionalities that enable efficient simplification, modification and repair of CAD geometry. Available measurement capabilities allow you to directly select and update geometric dimensions (e.g. widths, diameters) from the CAD model, facilitating efficient model updates and synchronization with design changes.
Mount Layout Analysis Assembly
A new Mount Layout Analysis Assembly has been introduced to enable a fast and efficient workflow based on simplified rigid or flexible bodies. The functionality is specifically designed for engine mount layout definition, early-stage NVH assessment and design optimization, making it well suited for case studies and parameter studies.
The assembly automatically inserts and connects joints based on the defined mounts and torque brackets, significantly reducing manual setup effort. All-important properties and settings are part of one global configuration menu. Multiple mount joint types are available, allowing you to model the characteristic behavior of different mount concepts. The position and orientation of mounts, bodies and torque brackets can be parameterized and varied within optimization or DoE studies.
The analysis provides direct visualization of the torque roll axis, supporting layout evaluation and mount tuning. In addition, modal analysis support has been extended and validated for this workflow: rigid bodies are now included in the modal results, and surface mesh deflections are displayed to improve interpretation of dynamic behavior.
Consideration of Pitch Error for Cylindrical Gears
The inner and outer cylindrical gear subcomponents of the Advanced Cylindrical Gear (ACYG) Joint now support defining a pitch error to accommodate manufacturing allowances.
You can choose from three options to define the pitch error:
- Single pitch deviation
- Cumulative pitch deviation
- Definition via harmonic functions

The pitch error can be specified individually for each flank side or as a common error for both sides. During the simulation, the pitch error is overlaid with any defined microgeometry or any misalignments such as tilting that may occur.

Stick-Slip Behaviour for Axial Friction in Spline Gear Joint
Friction forces, and in particular frictional locking, between shaft and hub of a spline-gear connection may significantly impact the transmissibility of structure-borne noise. To consider locking effects, the axial friction model has been extended by an elasto-plastic representation. The model utilizes an elastic part that acts until the yield friction (i.e. friction limit) is reached. This represents the stick phase. After the friction-limit force has been overcome by external loads, the model changes to slip mode by activating the viscous part of the Bingham model. The benefits of the model are:
- Avoid simplifications coming with a Coulomb approach
- More stable numerically because no explicit regularization is needed to cope with the transition from stick to slip and vice versa.
- Friction locking due to stick as it appears in many gearbox and EDU applications is depicted in accordance with physics.

Thrust Rolling Element Bearings
The new Thrust Roller Bearing joint provides dedicated support for accurate axial load representation and introduces two new bearing components: Needle Roller Thrust Bearing and Thrust Ball Bearing.
These models offer a more realistic calculation of axial stiffness, deflection and load‑carrying behavior in systems dominated by thrust forces. They also capture time‑varying stiffness effects caused by over‑rolling of the rolling elements, enabling more accurate prediction of dynamic behavior. Result quantities are aligned with those already available for radial rolling element bearings, ensuring a consistent and unified output structure across all bearing types.
This enhancement is especially relevant for automotive drivetrain and powertrain applications, where precise axial stiffness prediction is essential. Examples include planetary gear sets as well as electric drive units, where axial forces from helical gears or rotor dynamics require dedicated thrust support.

Cam-Roller Contact Modelling
Cam-roller contacts can now be modeled using newly introduced, dedicated subcomponents: Cam and Roller. Both subcomponents are designed for a simple but application-specific definition of cams and rollers. The cam profile can be defined using grinding machine-specific descriptions, such as for flat or cylindrical grinders, or alternatively using polar coordinates. The roller supports the definition of a barrel-shaped geometry, enabling realistic representation of crowned rollers.

To enhance contact simulation fidelity, the cam-roller contact can be discretized into multiple sections, enabling the consideration of roller barreling effects along the contact line. In addition, elasto-hydrodynamic lubrication (EHL) modeling is now available to compute contact stiffness and friction.

Analytic and 1D EHL for Line Basic Contour Contacts
The Basic Contour Contact joint now supports Elasto-Hydrodynamic Lubrication (EHL) modeling, providing both numerical and analytical solutions of the Reynolds equation for pressure distribution and oil film thickness. This update introduces advanced capabilities such as elastic deformation, pressure-dependent viscosity, cavitation effects and asperity interaction, enabling accurate simulation of mixed lubrication regimes. New capability delivers a significant step forward in tribology modeling, allowing you to capture lubrication effects with unprecedented accuracy in your simulations with:
- More realistic prediction of friction, wear and efficiency under operating conditions
- Improved durability and NVH analysis
- Enhanced design optimization for high-load applications like cam-follower systems

New Oil Splash Outflow Boundary Condition for EHD+T
A new boundary condition type has been incorporated for the thermal EHD calculation (EHD+T) in EXCITE M. This is only available for EHD+T models with thermal calculation mode which include bearing structures and where a structure enlargement towards the edges is activated/used.

Oil splash boundary conditions arise from the splashing out of bearing oil from the lubrication area. Up to a certain length, the boundary condition of the bearing structures is influenced by this oil splashing.
Export AVL EXCITE™ M Models as Python Script
EXCITE M now allows you to export the entire model, or only selected parts of it, as a Python script. The exported script leverages the EXCITE M Python API to recreate the original model state with configurable levels of fidelity.
This feature provides a convenient entry point for anyone who wants to start working with scripting in EXCITE M. The script will contain the syntax for the selected model components enabling user to first understand it and then further extend it.

The generated script can be prepared for execution in standalone (offline) mode using the sdt_python interpreter from the command line, or for execution directly within the Live Scripting pane during an interactive GUI session. You can control the level of detail included in the exported script, optionally omitting less critical model details and relying on default settings where appropriate.
Support for REXS Version 1.7
The import of REXS (Reusable Engineering EXchange Standard) files now supports version 1.7. This improves model exchange with third-party CAE and design tools and enables a more complete and consistent gearbox and transmission model import.

REXS version 1.7 extends the standardized, open and parameterized data model, allowing additional component types to be transferred without manually setting up those components. In addition, JSON-based REXS files are now supported alongside the existing XML format.
REXS version 1.7 introduces support for the following additional components:
- Thrust roller bearings
- Radial slider bearings
- Spline gear connections

As with every release of AVL FIRE™ M software features and simulation capabilities are provided in response to recently seen and anticipated future technological trends in the mobility sector and other industries. With 2026R1 again a strong focus was set on providing new and enhanced simulation models for advancing the development of modern powertrains. Find out about the highlights of the latest release.
Batteries
Battery Thermal Runaway on GPUs
With our latest 2026 R1 release we improved the GPU performance for simulations using the Species Transport Module. Customers can now benefit from this feature not only for battery thermal runaway simulations but other flow-based simulations as well.
In the image you can see a comparison of our previous 2025 R2 release with the latest release for a battery thermal runaway module GPU simulation. Roughly 25% of speedup could be achieved.
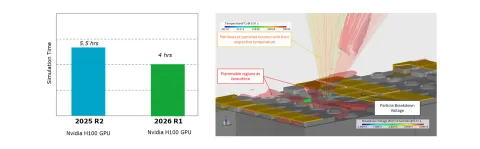
Particle-Induced Risk of Electric Breakdown
Version 2026 R1 presents a rapid, tunable, and pragmatic methodology for assessing the risk of particle-induced electrical breakdown within electrode gaps. The enhancement of local field strength is modeled using a distance-based correlation, which attains its maximum value in proximity to either electrode and its minimum at the midpoint between electrodes. The empirical model incorporates sensitivity to particle radius and includes a global scaling factor for calibration purposes. The particle breakdown field strength is determined according to the correlation established by Hara et al. (1977), with additional flexibility provided by user-defined parameters.
![Figure 2: Contour plots of potential of particles [V] and electrical field strength in the gas [V/m] for (a) 1000m particles and gap size 3mm, (b) 60m particles and gap size 3mm and (c) 60m particles and gap size 0.5mm](/sites/default/files/styles/original_small/public/2026-04/figure2_1.png.webp?itok=MyF9lyMK)
Temperature Dependency of Maximum Capacity
The maximum capacity in the equivalent circuit model can now be temperature-dependent. If a temperature dependency is included in the battery parameterization wizard, it is transferred to the GUI accordingly and applied in the solver.
Fuel Cells and Electrolyzers
Numerous enhancements are provided with FIRE M 2026R1 to support the development of fuel cells and electrolyzers in terms of technology and time to market. In detail this includes:
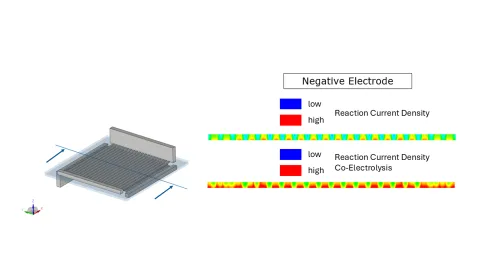
Porosity Media In Fuel Cell and Electrolyzer Simulations
Porous media can now be part of fuel cell and electrolyzer models. From 2026R1, both, the Porosity Module and the Fuel Cell/Electrolyzer Module, can be activated simultaneously. This integration enables accounting for the impact of porous structures, e.g. in regard to pressure drop, within fuel cell and electrolyzes simulations. Complex pressure drop models, such as the Forchheimer model, to better capture non-linear flow behavior, can be deployed. Offered in this context is also, the possibility to adjust the heat transfer between solid and fluid phases for each porosity. Furthermore the Knudsen diffusion model can be activated for each porous media domain, allowing for an accurate representation of gas transport in fine-pored materials.
Improved AEM and Alkaline Electrolyzer Modelling
For both types of electrolyzers the ion concentration is now treated differently in the Butler-Volmer equation. It is now part of the exchange current density, and it is also used in the NEMST equation.
For AEM electrolyzers, the ion mass transfer between the liquid electrolyte and ionomer has been enhanced. The mass transfer coefficient is now accessible via the property database and can be specified separately for adsorption and desorption. Additionally, the Donnan potential is now used in the ion mass transfer.
Also for AEM electrolyzers applies that, if a liquid electrolyte solution is fed to the cell, the electrochemical reaction now occurs directly within the liquid phase as a function of the liquid ion concentration. The total current provided from the outside is then transferred into ionic current via electrochemical reactions in the ionomer and the liquid phase. The current distribution between ionomer and liquid is related to the liquid volume fraction in the catalyst layer.
Notable also, for AEM electrolyzer simulations, the ionic conductivity can now be defined as a function of the ion concentration within the ionomer.
3D Reaction Zone for Solid Oxide Fuel and Electrolyzer Cells
To enhance the accuracy of solid oxide fuel cell (SOFC) and solid oxide electrolyzer (SOEC) simulations, the electrochemical reaction zone has been extended from a 2D surface to a 3D volume. Users therefore now can choose between 2D and 3D representations of the reaction zone, depending on their needs. The update also introduces ionic conductivity in porous solids and a volumetric exchange current density. Together, these enhancements enable more realistic simulation of ionic transport and a better representation of how reactions are distributed throughout the electrochemical reaction zone.
Generalized Domain Detection and Potential Initialization for Fuel Cell and Electrolyzer Applications
The domain detection and potential initialization algorithms have been generalized with 2026R1, to handle non-typical geometries such as cells connected in parallel or electrodes with multiple bipolar plates and GDLs. This improvement makes the algorithm less dependent on specific geometry assumptions.
Mesoporous substructure model for PEMFC catalyst layers
A new catalyst layer model for PEM fuel cells is now available: Mesoporous Substructure Model. It is the third available catalyst layer model beside the Agglomerate Model and the Macro-Homogeneous Model. The mesoporous substructure model enables material changes, e.g. change of the carbon support material, without the necessity to re-calibrate. Compared to the other catalyst layer models, the new model yields more accurate results in the high current density regime and is more sensitive to humidity variations.
Knudsen Diffusion in Porous Media
Knudsen diffusion effects are implemented with this new release, extending the multicomponent diffusion model. Knudsen diffusion occurs when the mean free path of gas molecules is comparable to or larger than the pore diameter of the material they are moving through. In this regime, molecule-wall collisions dominate over molecule-molecule interactions. This is especially relevant in porous materials with nanoscale pores, such as those used in SOEC electrodes. With this added capability, more realistic transport modeling in porous electrodes is enabled.
ICE-based Powertrains
New Solution App For In-Cylinder Flow Modelling
FIRE™ M 2026R1 offers a new solution app for generating and executing models for in-cylinder flow, fuel injection, air/ fuel mixing, ignition, combustion and emission analysis (in the following called “in-cylinder flow model”). The app simplifies, unifies, and accelerates the setup of preprocessing and simulation models. Users are guided step-by-step through the workflow by following the top-down menu structure of the app. At each step, users are supported by an intuitive graphical user interface and automated functions.
At the very beginning, users select the working principle of the engine to be modelled. Currently available options are: Spark ignited, Compression ignited, Pre-chamber, Port injection, Low pressure direct injection and High-pressure direct injection. Following this, the fuel to be used in the simulation is to be defined. While the most common fuels can be selected with a single mouse click. It is also possible to further refine and modify the selection, e.g. when intending to assemble a fuel out of multiple components.
In the next steps the user specifies the geometry (CAD Model) that shall serve model generation, specifies the number of intake and exhaust valves, the number of intake and exhaust ports and assigns markers (= "selections") to the individual parts of the model.
The selection definition process offered in the app is completely re-designed compared to what is known from FAME M Engine in previous releases of FIRE™ M. While the previously applied approach attempted to automatically identify all relevant parts of the model and to assign selections accordingly, the new solution enables interaction with the process and provides immediate visual feedback on the result. This helps to avoid errors, ensures nothing is overlooked, and offers the possibility of supporting the algorithm in the background should it fail.
Following that, the user provides additional information needed later to accomplish the generation of the simulation model. The input requested includes, among others, the specification of the cranktrain, compression ratio and valve lift curves.
Having done this the user moves on to provide the geometrical setup of the spray/fuel injection. This includes for example the position and axis of the injection nozzle, the number and arrangement of the injection holes and the spray cone angle. Also start and end of injection as well as the injection rate shall be entered. No numerical model parameters are requested.
The specification of the geometrical data referring to the fuel injection, is needed to later incorporate a spray block into the engine model. This spray block is a specifically designed structured grid helping to minimize numerical effects during fuel spray simulation.
After defining also initial and boundary conditions all information is forwarded and the simulation model is set up based on the previously made selections and provided inputs. At this step the user is supported with pre-configured numerical setups matching engine type, working principle and fuel as initially specified. Users can, however, still make changes to both the meshing and the simulation setup, if they intend to do so.
Ending the model setup, the model execution can be started. New in 2026R1 is that model generation, i.e. mesh generation, is done simultaneously to the simulation. This is possible because in 2026R1 the FIRE™ M solver initiates mesh generation during the ongoing model execution. Compared to a "mesh-in-advance-approach" users now do not need to wait for long between pressing the START button and seeing the first simulation results. Of course, if someone prefers to continue working with the up-to-now standard in-advance meshing, this is still possible. Also, the option exists to check the meshing setup, or to even generate meshes, for only specific crank angles. Thus, users can make sure that the provided input meets expectations, before proceeding with the "meshing-during-simulation-approach".
While the workflow reflected in this solution app is further streamlined compared to the standard FIRE M workflow for in-cylinder flow modelling, there is no loss in flexibility or modelling depth. Users have access to all model parameters as previously and the workflow known from earlier FIRE M versions remains available in parallel to this new solution app.
New Multi-Component Cavitation Model For Simulating Diesel Blends
Since 2022, FIRE M offers a multi-component flash boiling model capable of predicting the evaporation and formation of mixtures of multi-component fuels.
In preparation of the release 2026R1, although, a new model was developed to account for injections of multi-component diesel fuels into chambers with a pressure ranging somewhere between ~50 and ~100bar. Under these conditions the phase change of the fuel components begins already in the injector, where gas bubbles are surrounded by liquid.
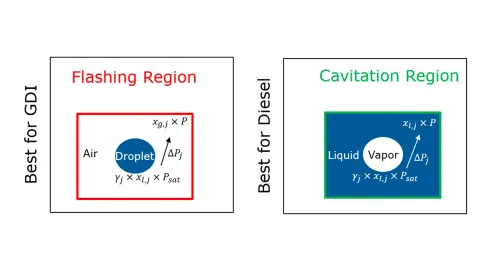
The new model accounts for the fact that the evaporation of diesel fuel components is driven by the difference in partial pressures. The model distinguishes between the cavitation region, where the pressure difference is defined by the component's saturation pressure and the liquid's partial pressure, and the flashing region, where the pressure difference is defined by the saturation pressure and the fuel component's partial pressure in the surrounding gas mixture.
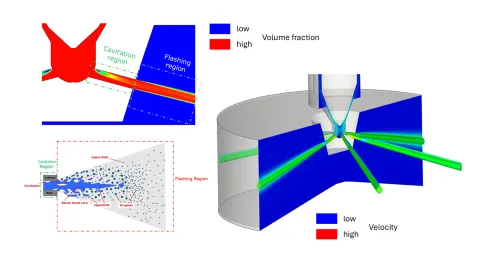
The model has already been successfully applied to injector flow simulations involving three diesel blends, in which diesel was mixed with FAME-S in ratios of 10:90, 50:50 and 90:10. FAME-S is less volatile than diesel because it has a lower saturation pressure. The new model reasonably predicts the cavitation of the different blends for each component. This is an important step toward simulating the formation of mixtures of arbitrary fuel blends based on diesel, gasoline or any other liquid fuel.
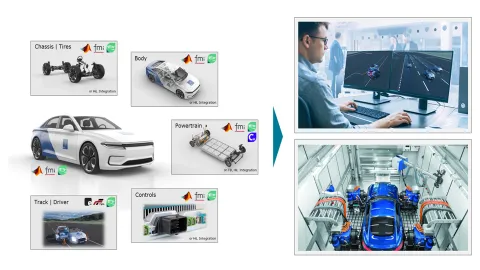
AVL VSM™ Brings More Realistic Off-road Simulation, Improved Ride & Comfort Physics, Streamlined Experience for Customizing Parameters and Refined Brake Control and Tire Temperature Model
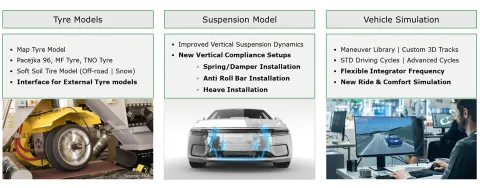
More Realistic Off-road Simulation
Our newly launched VSM™ enhanced off-road simulations by advancing vehicle physics for applications on fully 3D terrain, considering both office and driving simulator environments. The enhanced modelling allows the vehicle to respond more naturally to uneven, deformable, and highly variable surfaces, improving driver immersion and predictive accuracy. This is particularly relevant for scenarios involving steep gradients, road obstacles, and soft soil conditions, where precise force distribution and body motion are critical to realism.
At the core of this solution is the integration of the exclusive VSM™ soft soil tire model, which provides a more detailed representation of tire behavior on loose and deformable surfaces such as dirt road, sand, field, mud, and snow. By capturing sinkage, traction limits, and soil-tire interaction effects with higher fidelity, the model enables more accurate simulation of vehicle mobility and handling in challenging environments, especially in low-grip and highly nonlinear conditions that are difficult to reproduce with conventional tire models.
These capabilities are further extended to support multi-axle vehicles, as well as special-purpose and security & defense applications, where off-road performance is mission-critical. The improved physics ensures consistent and reliable behavior across complex vehicle configurations, including heavy-duty platforms and articulated systems. Altogether, the enhancements provide a robust foundation for high-fidelity simulation, enabling engineers and operators to evaluate performance, training scenarios, and vehicle limits with confidence.

Improved Ride & Comfort Simulation
The new release significantly advances Ride & Comfort simulation by refining the underlying vertical dynamics of the vehicle. Updated suspension modeling delivers a more accurate representation of vertical body motion, particularly in the frequency range that dominates perceived ride quality. In addition, new vertical compliance setups allow engineers to better reproduce the interaction of road inputs and the vehicle body and occupants.
Following the previous external tire integration of VSM 2025 R2, the 2026 R1 release supports the latest tire models. This update improves the fidelity of tire-road interaction, where tire dynamics play a key role in harshness and vibration behavior. Together, these tire models enable a more comprehensive representation of different road excitations, enhancing confidence in simulation results across a wide range of driving conditions.
Streamlined Experience for Customizing Parameters
2026 R1 releases a streamlined experience for customizing parameters, enabling users to integrate and manage custom models within the VSM™ software environment. Through support for FMU and Simulink-based extensions, users can introduce their own parameters and directly configure them within the software’s GUI.
This unified workflow simplifies model setup and eliminates the need for external preprocessing, allowing engineers to efficiently define, adjust, and iterate on parameters while staying within a single environment. It also unlocks advanced studies such as optimization runs and DOEs, accelerating model calibration and performance exploration.
To further enhance usability and robustness, the new parameterization check feature ensures that selected models and parameters are consistently defined and compatible. By automatically validating configurations, it helps users avoid setup errors and maintain model integrity across different simulation scenarios.
Together, these improvements provide a more intuitive and reliable workflow, empowering users to focus on analysis and development rather than model management.
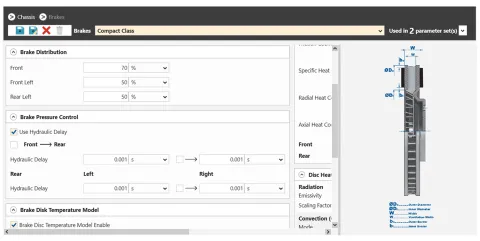
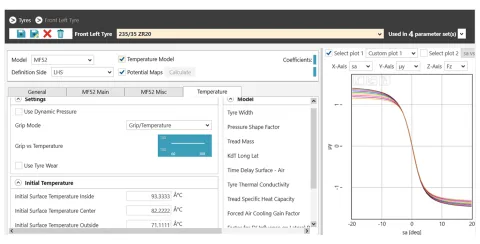
Brake Control and Tire Temperature Model
Complementing these updates, the 2026 VSM™ hydraulic brake delay (all applications) and tire temperature model (sports cars application) has also been refined to better reflect its influence on vehicle performance characteristics. Altogether, these improvements provide a more robust and predictive simulation environment, allowing engineers to evaluate and optimize vehicle performance earlier and with greater precision.
ChatSDT – AVL’s AI-Powered Customer Support Assistant
Active Model and Selected Elements Referencing in ChatSDT
ChatSDT now supports referencing the active model and selected elements using natural phrases such as “the model”, “current model”, “this subsystem” and “selected elements”. This enhancement makes it easier to query and inspect models and elements in ChatSDT.
AVL IMPRESS™ M Result Visualization and Reporting
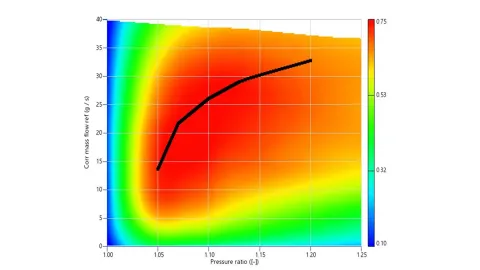
Operating Point Shown on Input Map
When input maps, e.g. charger performance maps, are displayed in a 2D surface chart, you can add time-dependent curves (e.g. pressure ratio and corrected mass flow) to the diagram to display the operating point. The animation will move the point on the map, and the point will leave a trace to show history.
Design of Experiments and Optimization
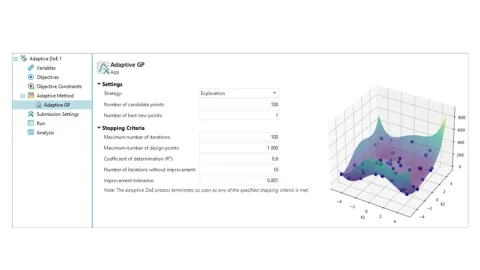
Introduction of Adaptive DoE in AVL Simulation Desktop
The capabilities of the Optimization tab in AVL Simulation Desktop are being expanded. Alongside the existing Optimization and Design of Experiments (DoE) features, a powerful new option is now introduced: Adaptive DoE. Adaptive Design of Experiments is an iterative, machine‑learning‑driven approach to building high‑quality surrogate models and identifying optimal system behavior with fewer simulation runs. Instead of predefining all sampling points upfront, as in standard DoE, Adaptive DoE evaluates initial results and then strategically selects new sampling points where they will provide the most information.
AVL EXPLORE™ - Data Analyses and Surrogate Modeling
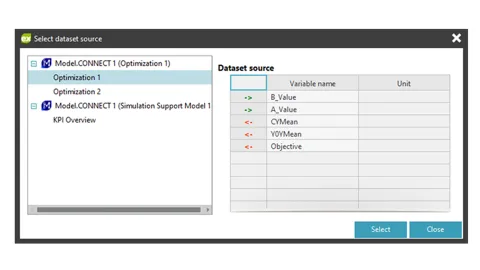
Data Access and Analysis Extensions – from Simulation DOE and via FMU
A streamlined and fully integrated workflow connecting SDT Client Simulation and EXPLORE is introduced. Running a Design of Experiments (DoE) or an Optimization Run in SDT produces a Parameter/KPI run table. This data is now accessed directly in EXPLORE as a selectable option in the Dataset Import UI.
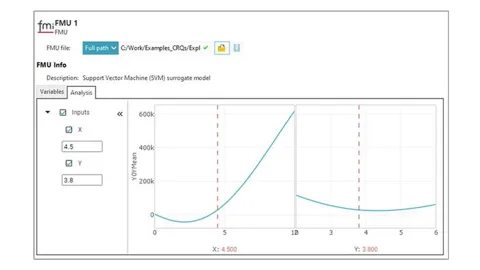
You can now visualize and analyze imported Functional Mock-up Units (FMUs) directly within EXPLORE, even when the original dataset is not available. FMUs can be examined through the Intersection Plot, which supports input-output influence analysis by illustrating how each input variable affects each output, providing a transparent view of model sensitivity.
Stay tuned
Don't miss the Simulation blog series. Sign up today and stay informed!