Wouldn't it be handy to have a running SOxC model with just a few clicks? CRUISE M now offers such a feature, allowing experienced modeling engineers to save time and enabling newcomers to easily begin with SOxC simulation based on nothing more than data from stack specification sheets. CRUISE M not only generates the model, you are also offered a tailored dashboard for online monitoring and online control, and you receive an offline result report directing you to the essential results characterizing the stack model. As an option, you can choose between internal reforming of CH4 and NH3 and you can also configure thermal conditioning, or you might like to step into the experienced user's settings and configure details on the electrochemistry and the spatial resolution of the stack model.
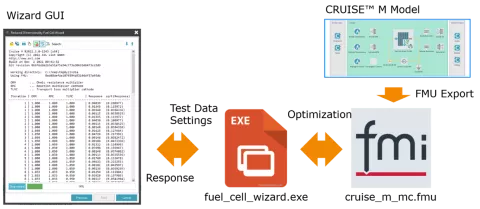
Wouldn't it be time-saving to have a guided workflow to configure an SOxC stack model? CRUISE M's SOxC Generator makes it possible. It offers a stepwise process to identify parameters for the cell voltage or species conversion based on reference data. The workflow supports fuel cell and electrolyzer operation. In the first step, you provide either steady-state (i.e. classical polarization curves) or transient data over time. These reference data are meant to comprise information on current and voltage, air and fuel supply, inlet and outlet species fractions, pressures, etc. In a second step, you select the variation parameters, their initial and range values and you can optionally tweak the settings of our optimization method. In the third step, you click the "run optimization" button and you have time for a coffee. When the optimization is done, CRUISE M provides comparison plots on the initial, reference and optimized data and parity plots, giving a fast overview on the fit quality. The last step is to generate the model and to guide you to CRUISE M with a ready-to-run model parameterized to your data.
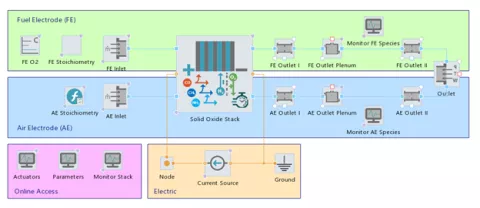
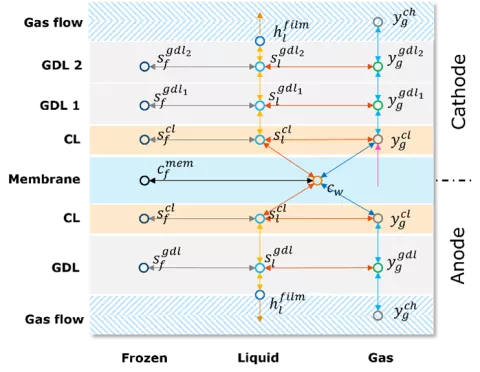
Detailed modeling of all electrochemical, transport and conversion phenomena in the MEA is key as it has a decisive influence on the overall stack performance. CRUISE M addresses this challenge with a new 1D electrochemical model in its fuel cell stack component. When selecting the new model, you have access to a broad list of functionalities:
- The gas diffusion layer (GDL) can be split into (sub-)layers featuring different material properties influencing the transport resistance for gases and liquids, enabling the consideration of the impact of microporous layers (MPL) on the cell/stack conversion efficiency.
- A liquid water transport model is made available, describing capillary transport in a physical-based manner, and considering local vapor pressure for the phase change between liquid and gas, allowing an in-depth analysis of cell-internal self-humidification phenomena.
- At the interface between GDL and channel, a dedicated film model takes care of the liquid transfer into the bulk flow of the channel. The transfer considers direct evaporation from the film, as well as the tear-off of liquid droplets that are further transported along with the gas flow, and thus enabling detailed assessment of macroscopic liquid water transport.
- The formation of ice in the membranes can be chosen to model its impact on the gas and liquid phase transport resistance. This is key when addressing fuel cell de-frosting processes and thus supports the assessment of different cold-start/freeze-start strategies.
- Species cross-diffusion is resolved in 1D via a multi-species model, offering a precise prediction of all transport phenomena influencing the stack dynamics at different frequencies.
Each single functionality can be optionally selected. With that, you can activate all features in a stepwise manner, or you can pick only those that fit your application case.
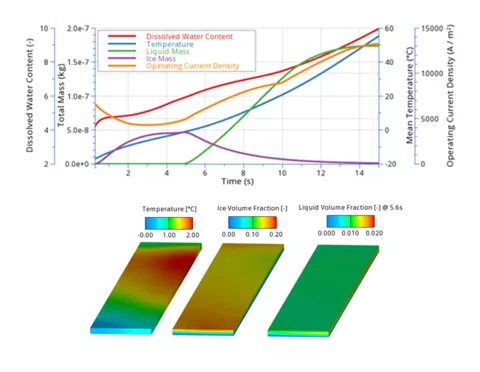
For low temperature PEM fuel cells, it is now possible to calculate the freeze start from subzero temperatures. Ice formation and respective phase change processes in the porous media can hence be analyzed in fully space- and time-resolved details. With the current FIRE M version, water can exist in five different states in a PEM fuel cell, namely the gas, liquid and dissolved state, as well as the ice state and the frozen dissolved water state. Phase change models are available for the five states of water. To describe phase change in the porous media in a highly accurate manner, the so-called Gibbs-Thomson undercooling effect is included, representing the effect of wettability and pore size on the melting point.