What Are the Limits of Battery Fast Charging?
Published on August 25, 2025 · 11 min read
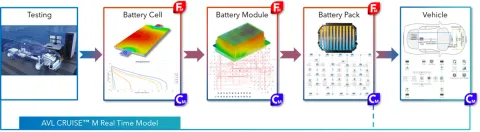
AVL CRUISE™ M is a multi-disciplinary and multi-physics system performance simulation tool. The simulation software offers a wide range of applications in the field of battery technology. These include, for example, a comprehensive solution for simulating lifetime, thermal management, thermal safety, and performance design of batteries.
For seamless product development—from the battery to the vehicle—CRUISE M can be coupled with the vehicle's energy management and thermal management models.
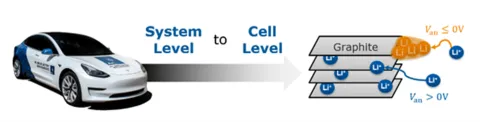
The CRUISE M battery model offers a variety of options, allowing users to choose from four levels: global heat source, Ohmic internal resistance heat source, equivalent circuit model, and electrochemical model. The commonly used battery models are: the equivalent electrical circuit model and the electrochemical model. Using the electrochemical model as an example, we present the general procedure for battery fast charging simulation in CRUISE M and explain the limiting factors in fast charging batteries.
In general, the limitations of the battery charging process are manifold and usually include charging power limit, charging current limit, battery temperature limit, voltage limit, and anode potential protection limit. To understand why the battery charging speed is limited and how optimization can be achieved, you can use the software to consider all limiting factors.
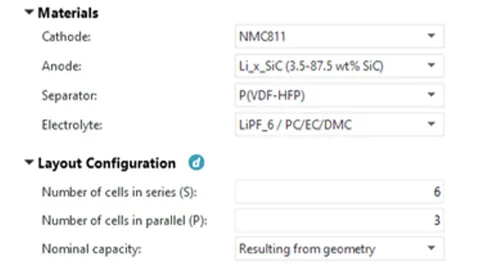
The example illustrates a 3P6S pouch cell module. The cell size is 354*96*9mm, with an NMC 811 chemistry. The capacity of a single cell is 60Ah, the initial SOC is 20%, and the fast charging range is from 20% to 80%. Based on the simulation requirements, the fast charging model is built as follows:
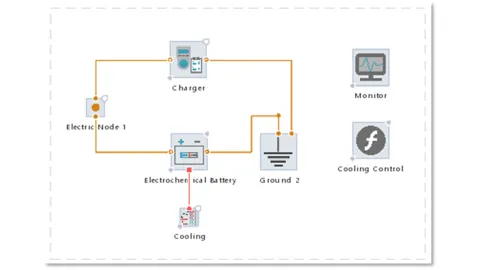
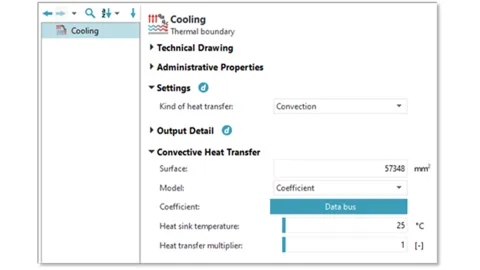
The battery is charged by a battery tester component called “charger” while being thermally regulated by a cooling boundary. The cooling strategy is written in a function “Cooling Control”.
In CRUISE M, there are two types of electrochemical models: the pseudo-two-dimensional model (P2D model) and the single particle model (SPM model). In the P2D model, lithium ions (Li+) are transported in the direction of the cell thickness, i.e., from the negative electrode through the separator to the positive electrode. At the microscopic level, Li+ diffuses from the center of the spherical electrode along the radius of the surface of the particle. There, they migrate and diffuse to another electrode after intercalating in the electrolyte. Subsequently, Li+ diffuses from this electrode to the center of a particle after embedding in the surface of another electrode. The SPM model considers the microscopic dimensions of the transport of Li+ ions from one electrode particle to another through a liquid membrane phase.
The P2D model demonstrates a high degree of accuracy; however, it requires a substantial amount of parameter input and a large number of nonlinear equations, so the computational efficiency is low. The single-particle model has been demonstrated to facilitate rapid simulations of the charge and discharge processes of batteries at a rate of 1C. The SPM model neglects electrolyte effects, so it can be inaccurate for high C-rates, depending on the cell type. However, since it is very fast (up to 1000 times faster than real-time), it can be used for first concept studies and then be replaced by a more accurate P2D model.
The software provides various functions that support the development of electrochemical models. These include the Electrode Balancing Wizard, which enables rapid parameterization of the electrodes based on test data. After receiving the electrode data, the reaction kinetic parameters of the device must be determined using the electrochemical impedance spectra. The EIS Wizard allows the parameterization of the reaction dynamics parameters and the combination of the diaphragm and electrolyte parameters.
As shown in Figure 4, once the electrodes are parameterized through the Electrode Balancing Wizard, the CRUISE M database contains customized electrode information, and the corresponding electrode material, separator material, and electrolyte materials are selected in the electrochemical model component.
If the battery temperature is above 35°C, the cooling strategy can simply be defined as active, and as inactive if the temperature is below 32°C.
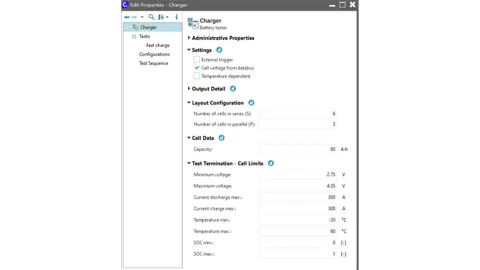
As already mentioned, battery charging is limited by various factors such as current/power, temperature, voltage, anode potential protection, etc. The Battery Tester component takes these limitations into account. The component settings can be used to freely examine the charging and discharging currents. In addition, you can implement PI control of the temperature and anode potential. To do this, you first need to enter the module and cell information in the “Layout Configuration” and “Cell Data” sections. In the “Cell Limits” section, you define the limiting protection conditions for the battery, such as upper and lower voltage limits, temperature ranges, etc.
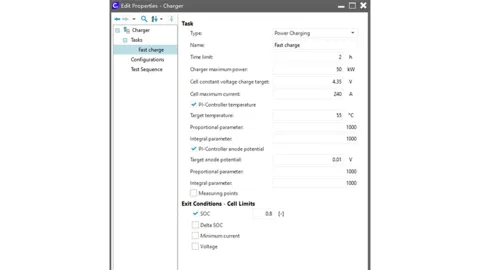
A fast charging task is defined with a power limit of 50 kW, a current limit of 240 A, and an upper voltage limit of 4.35 V. Activate the PI controller temperature and PI controller anode potential below and enter the upper temperature limit and lower anode potential limit. Note that an anode potential below 0 will result in lithium plating in the battery, which will affect battery life and safety. To prevent this, ensure that the anode potential is greater than 0. A safety margin of 10 mV is assumed as the lower limit here.
Once the data bus connection and solver settings have been configured, the model is complete.
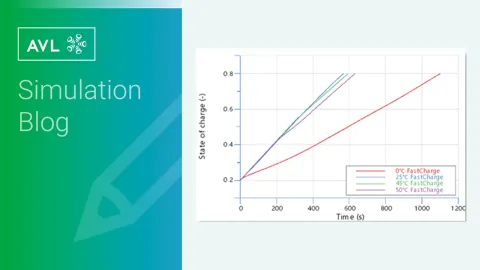
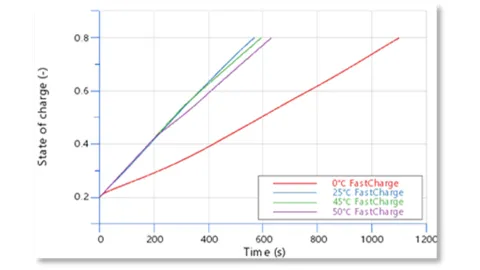
Multi-calculation was used to simulate four charging conditions with initial battery temperatures of 0 °C, 25 °C, 45 °C and 50 °C. Figure 7 shows the SOC and module currents, and it can be seen that the charging speed is fastest for an initial temperature of 25°C and slowest for an initial temperature of 0°C. In fact, different ambient temperatures have different limiting factors.
More information can be obtained from Figure 8 battery temperature. Since we set the temperature protection at 55°C, we can see that, in two conditions with initial temperatures of 45°C and 55°C, the battery temperature quickly reaches 55°C. This triggers the PI temperature controller, resulting in a significant decrease in the charging current. As shown in Figure 7(b), at the respective time points when the battery temperature reaches 50°C in the two sets of conditions, there is a significant drop in the current; in other words, the battery temperature restricts the charging current.
However, the situation is different when the initial temperature is 0°C. As Figure 8 shows, the battery temperature never reaches 55°C when the initial temperature is 0°C, yet the charging current remains at its lowest throughout the entire process. This is because the anode potential of the battery is lower at low temperatures, making the lithium plating protection easier to trigger. See Figure 9.
As can be seen, when the initial temperature is 0°C, the anode potential is initially lower than 10 mV, triggering the PI anode potential controller and limiting the charging current. In the case of an initial temperature of 25°C, the anode potential also falls to around 10 mV in the late stage, triggering current protection and limiting the current.
We have used a simulation model in CRUISE M to observe the limiting factors in battery charging, which can help to understand the process better. One advantage of the CRUISE M model is that it is simple to build. Through the electrochemical model, we can explore the battery's potential for fast charging and evaluate this in the concept phase.
For fast charging simulations, more work is required to analyze the different constraints affecting charging time and to optimize charging speed.
Stay tuned
Don't miss the Simulation blog series. Sign up today and stay informed!
Read More About This Topic

In the third edition of this series, we will dive into one of the major technology drivers for the automotive industry – battery technology. Our experts present solutions that break the boundaries of conventional battery design.

In many markets, battery electric vehicles have yet to achieve the same level of acceptance as combustion engine vehicles. To make them more competitive, it is essential to reduce the cost of EVs and build confidence in their safety.
Stay tuned for the Simulation Blog
Don't miss the Simulation blog series. Sign up today and stay informed!