Analyzing Critical ADAS/AD Scenarios With AVL Scenario Simulator™
Published on September 13, 2024 · 7 min read
In Scenario Simulator, analysis takes place on two levels: The run history provides an aggregated view on all executed simulations based on test parameters and KPIs/safety metrics. This allows for a quick high-level comparison of different ADAS/AD software versions. It also allows to cluster and filter failed tests for an efficient detail analysis of individual tests.
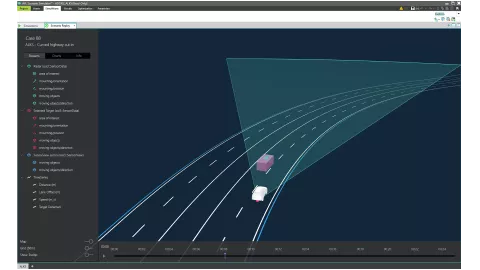
The Scenario Replay feature enables a 3D playback of recorded ASAM OSI® data as well as timeseries data. This allows analysis from all angles and different sensor data streams to investigate the exact cause of a failed test and provides important debugging information for the ADAS/AD developers. Based on this information, they can improve the handling of the safety-critical situation in the next version of the ADAS/AD software.
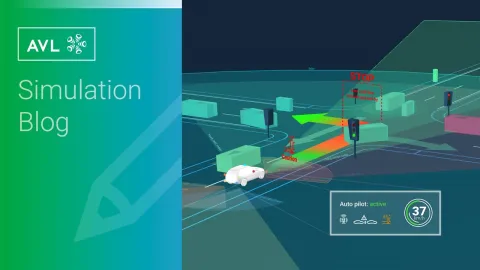
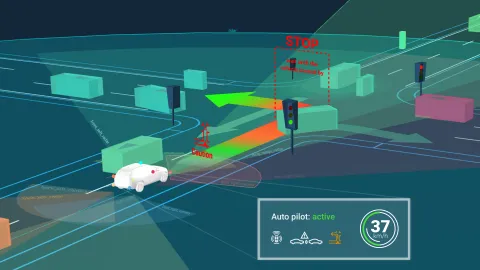
In the following example, the unit under test is the ADAS/AD function. The function developer changes the ADAS/AD function and wants to see how successful the function behaves. The success of such a function is measured by common KPIs like time to collision during the simulation of a scenario. Time to collision is defined as the time delay remaining between the time instant considered and the time of the collision between the vehicle and any other vehicle, irrespective any alteration of speeds and directions during that time delay. Obviously, this should never be below a certain threshold.
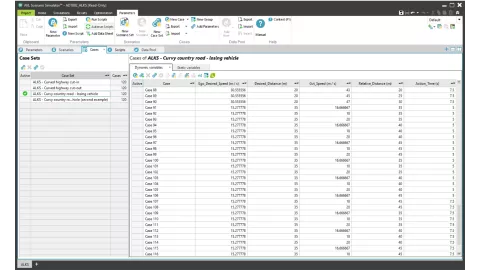
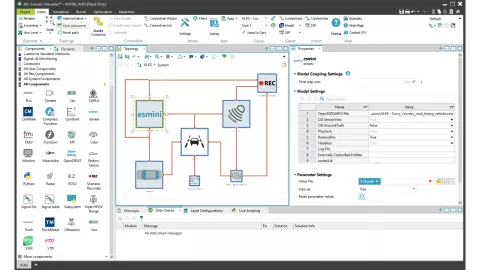
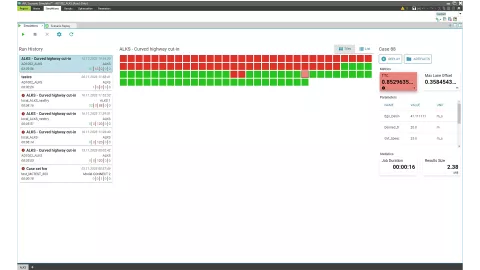
For the test, we used what is called a logical scenario. A logical scenario defines the parameters of the scenario. By applying concrete parameter values, concrete scenarios can be created. In the screenshot below you can see that we use the usual SDT case sets to represent logical scenarios and cases to represent specific scenarios.
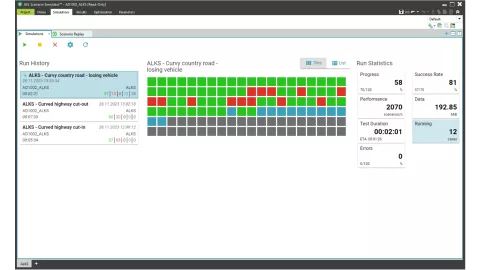
The simulation dashboard gives an aggregated overview of all performed simulations for the project. It enables software developers and validation engineers to analyze simulation results, compare to older versions and deep dive into single failed tests with the 3D scenario replay tool.
In the dashboard view, the user can start runs and see the progress of the simulations. A green tile in this window indicates that the KPIs of a particular scenario are within the allowed ranges, while a red tile indicates that some KPIs violate the acceptance criteria. Blue tiles represent running simulations and gray tiles represent pending jobs.
By clicking on individual tiles, users can access more detailed information about each case on the right side of the screen (such as parameter and KPI values).
For a more detailed analysis of what actually happened in a scenario, the user can click the Replay button and review the recorded simulation in the Scenario Replay.
These dashboard views and the Scenario Replay are created using web technology to be already prepared for the upcoming task of running all these simulations in the cloud and just providing the user access to a web-UI to inspect the simulation results.
The AVL SCENIUS™ toolchain enables a companywide collaboration and traceability of all scenario-based tests. The holistic solution covers the entire workflow from requirements engineering, via scenario creation and management, to test case planning, execution, and reporting. Thanks to native support for the ASAM OpenSCENARIO® standard, all modules also work standalone and integrate seamlessly into any existing tool landscape.
Watch the Whole Scenario Analysis Workflow
Stay tuned
Don't miss the Simulation blog series. Sign up today and stay informed!
More About This Topic
The fifth part of this online event series focuses on our simulation solutions for automated and connected mobility. Join us and benefit from our know-how of efficient and reliable virtual validation. Hear from industry experts, engage in insightful discussions, and be part of shaping the future of autonomous driving.
The new AVL Scenario Simulator™ is a cost-optimized solution for fully automated, large-scale ADAS/AD testing. Build the optimal virtual prototype for each test purpose.

Scenario-based testing is established as an efficient method to test critical traffic situations in a reproducible way. The AVL SCENIUS™ toolchain for scenario-based testing ensures end-to-end consistency and traceability, from the requirements to test reports, enabling a thorough safety argumentation and type approval process.

Our simulation expert will give you a free training where he will walk you through all the typical steps necessary to integrate and test an Advanced Driver Assistance System (ADAS) or Automated Driving (AD) software in a virtual environment.

Join our podcast for insights into mobility technology. We cover general topics and technical deep dives, including EV, ADAS, and simulation/testing. Perfect for technical enthusiasts, managers, and new engineers seeking high-level understanding. Share your perspective in our dynamic industry.
Stay tuned for the Simulation Blog
Subscribe and don‘t miss new posts.