The setup of balance of plant (BoP) models for PEM fuel cell systems can be demanding. It requires basic knowledge of the system arrangement, the adopted components, and their sizing - do they fit to the actual performance range of the stack itself. Moreover, there are several basic control functions required to operate the entire system under transient load conditions.
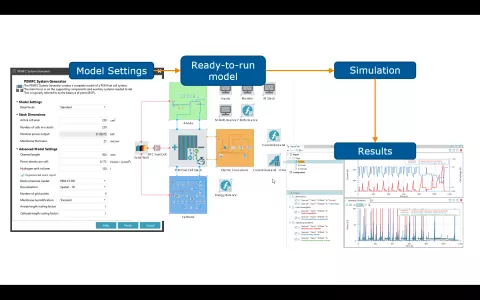
With its PEMFC System Generator, AVL CRUISE™ M provides you with a convenient way to expedite the model setup and parameterization process. The starting point for the complete model setup is nothing more than two parameters: the active cell area and the number of cells in the stack. With that, you are good to go and can create the model. If desired, there are a couple of input options to shape the model generation process according to your needs.
Once the model is created, you have full access to any component for further customization. This includes access to the code that takes care of the plant controls and the ability to flexibly define any transient load profile.
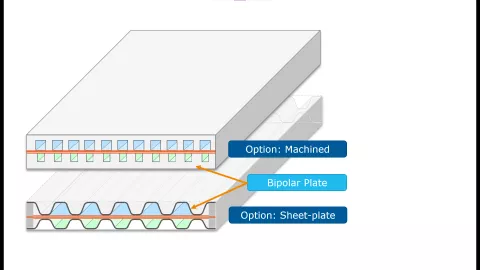
One way to reduce the mass and thermal inertia of fuel cell stacks is by changing from machined bipolar plates to stamped sheet plates. The latter features thinner walls and an increased ratio of active channel cross section and cooling cross section at the same time.
In this version of CRUISE M, you can flexibly simulate this kind of bipolar plate geometries. You only need to specify the channel width, the plate height and the sheet thickness on anode and cathode side and you are ready to proceed. KPIs regarding stack and bipolar plate, channel and cooling volumes give you immediate feedback on the geometrical reasonability of your inputs. The difference between machined bipolar and sheet plates is elaborated in a dedicated installation example that fully accounts for 3D temperature distribution effects in the stack. This example is ready to run and serves as a starting point for your customized simulations, e.g., analyzing the impact of different operating temperatures on the stack hydrogen conversion efficiency.
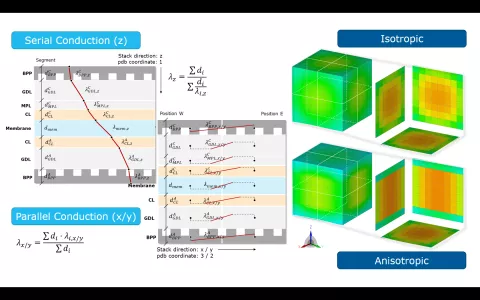
Fuel cell stacks are an assembly of individual cells, each comprising of bipolar plates, gas diffusion layers and the membrane. Each layer intrinsically features heat conduction, even when modeling the thermal behavior of the stack in a lumped manner, it is important to account for anisotropic heat conduction for both in-plane and in perpendicular direction.
When running a 3D thermal stack model in CRUISE M, you can choose between isotropic and anisotropic heat conduction. Additionally, you can scale the calculated heat conduction derived from the genuine material data. The scaling values can also be connected to the CRUISE M data bus network. This gives you full flexibility for model parameter identification even during a running simulation. A dedicated installation example is available to demonstrate the heat conduction related functionalities, including a comparison of the spatial temperature distribution during a cooldown phase for a stack featuring isotropic and anisotropic heat conduction.
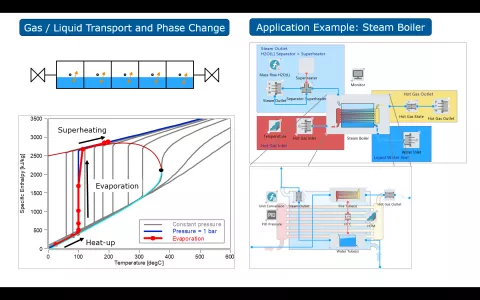
The simulation of solid oxide fuel cell and electrolyzer systems requires consideration of not only the transport of gaseous species but also of species in the liquid phase, since electrolyzer and steam boiler components are typically fed with liquid water, while partly or fully gaseous species exit these components.
This version of CRUISE M allows to consider the availability of liquid species in the thermodynamic gas network. Gaseous and liquid fluid components are transported through the entire network, with phase change processes modeled in the state components, like plenums and the quasidimensional pipe (QDP). In the current version of CRUISE M the liquid transport model is validated with its own VLE (Vapor-Liquid Equilibrium) flow network for temperature ranges where the specific enthalpies are linear over temperature, i.e. for operating points significantly below the critical point.
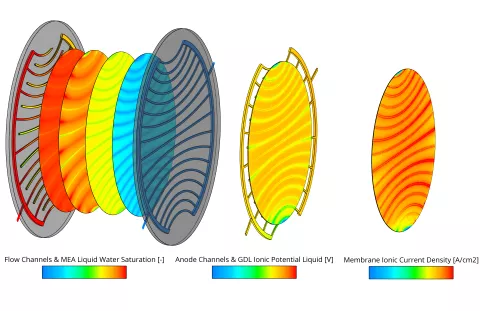
The PEM fuel cell module of AVL FIRE™ M has been extended to also cover the simulation of Anion Exchange Membrane (AEM) electrolyzer cells. AEM electrolyzers are alkaline electrolyzers in which the diaphragm located between the electrodes is replaced with an ion exchange membrane. Although AEM electrolyzers can be operated with pure water, the cells are usually fed with a weak aqueous electrolyte solution to increase the performance. Often KOH (potassium hydroxide) or NaOH (sodium hydroxide) are used as electrolytes. The charge transport across the membrane occurs via the transport of anions (OH-) rather than cations (or protons). A commonly used material for the anion exchange membrane is hexamethyl trimethyl ammonium-functionalized Diels-Alder polyphenylene (HTMA-DAPP).
The biggest differences in the AEM and PEM electrolyzer modeling are caused by the existence of the liquid electrolyte. Therefore, FIRE M solves additional transport equations for the liquid ion mass balance and liquid charge conservation equation in the liquid electrolyte. At the interface between the liquid electrolyte and ionomer, a mass transfer approach is adopted, making it possible for anions to enter and exit the membrane. To calculate the distribution of the ion concentration more accurately, an additional ion transport equation in the ionomer phase of the membrane is solved. The ion concentration is also added to the Butler-Volmer equation to account for a faster oxygen evolution reaction under higher anion concentrations.
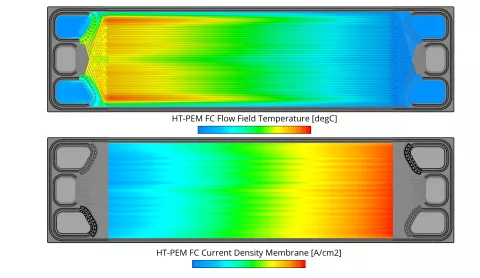
In the current release the fuel cell module of FIRE M has been extended to include the simulation of High-Temperature PEM fuel cells. The main differences to the Low-Temperature PEM fuel cell are the operating temperature which is typically in the range of 130-180°C and consequently the absence of liquid water. Due to the high operating temperature, a different membrane material is used. The most common materials are porous polybenzimidazole (PBI) based membranes doped with phosphoric acid. The ionic conductivity is provided by the phosphoric acid and typically only dependent on temperature. In the phosphoric acid, the different species can cross the membrane and in the case of O2 and H2 lead to parasitic reactions on the opposite side which are accounted for in the present model. All degradation mechanisms in the catalyst layer are modeled in the same way as for the Low-Temperature PEM fuel cell.