


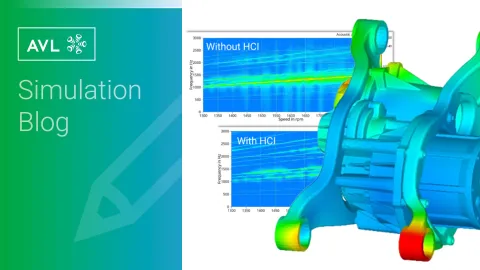
Simulating Harmonic Current Injection with AVL EXCITE™ M
Published on November 18, 2025 · 2 min read
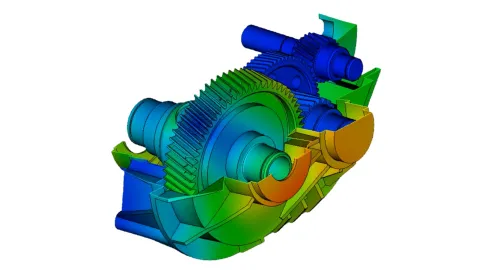
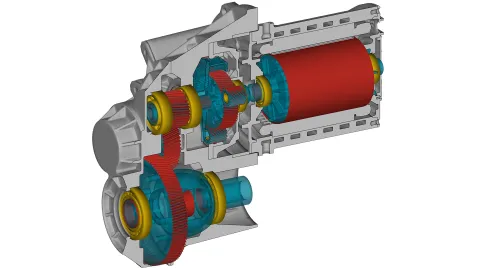
To gain a deeper understanding of potential excitations, an e-drive system was modeled in detail using AVL EXCITE™ M. In addition to shafts and bearings, housing components were represented as flexible structures. The electromagnetic excitations of the e-machine were pre-calculated using the AVL E-Motor Tool™ (EMT) and integrated into the simulation via a FEM based circuit model (File Based Model).
A virtual run-up was then performed:
- Speed range: 1000 to 9000 rpm
- Load: 175 Nm constant
- Duration: 9 seconds
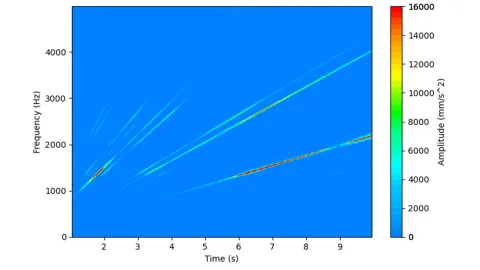
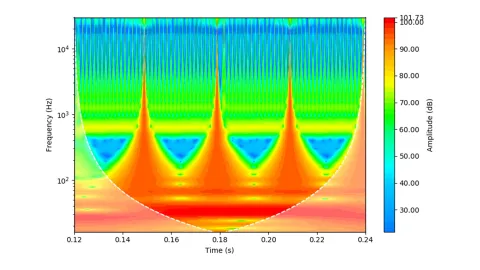
This scenario corresponds to a typical real-world vehicle acceleration and allows the detection of resonances across the entire operating range. Accelerations were recorded at several virtual measurement points on the housing. A critical point stood out, where a pronounced resonance developed at around 1600 rpm. A Short-Time Fourier Transform (STFT) revealed a strong vibration response at about 1280 Hz—a classic indication of excitation of a housing eigenmode, see Figure 1.
Simply identifying a resonance does not answer the key question: Where does the excitation come from?
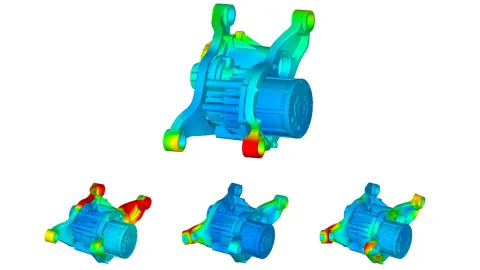
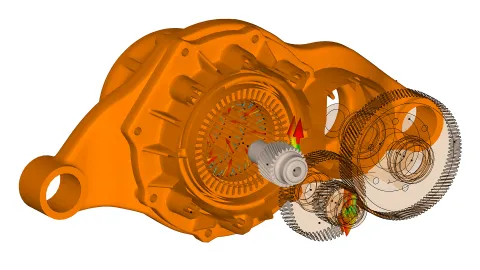
A modal analysis of the entire system was carried out at the operating point of 1600 rpm. The system stiffness was linearized, including nonlinear effects from bearing and gear stiffness, to represent the system characteristics in the “installed state.” The analysis showed that modes 35, 37, and 38, with natural frequencies around 1365 Hz, dominated the vibration behavior. A comparison with deformation patterns from the run-up confirmed the match, see Figure 2.
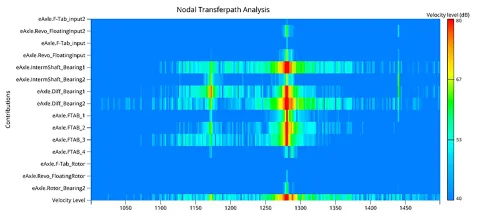
Next, a Transfer Path Analysis (TPA) was performed. The critical housing point was chosen as a reference, and the transfer paths were traced back. It became clear that the excitation was mainly introduced into the housing via the bearings. A spectral analysis identified the dominant excitation at 1280 Hz—exactly the 48th order of the e-machine. The cause was clear: a torque ripple from the 48 stator teeth coupled through the shaft and bearings into the housing, exciting the mentioned eigenmodes.
To address this issue, Harmonic Current Injection method was applied. This involves deliberately injecting harmonic current components into the stator to create an out-of-phase excitation. When amplitude and phase are correctly chosen, excitation and counter-excitation largely cancel each other out.
In EXCITE M, the parameters were optimized in the digital twin. The following values were obtained for the critical operating point:
- Amplitude: approx. 30% of nominal current
- Phase shift: approx. 14° relative to the base excitation
The superimposed 48th harmonic was clearly visible in the simulated current profile. The effect was immediate: the 48th order in torque was reduced by about 75%, and acceleration at the critical housing point dropped by 60%, see Figures 4 and 5.

The success of HCI was also evident in the repeated run-up from 1000 to 9000 rpm. While the original model showed a pronounced resonance amplification at 1600 rpm (or 1.85 seconds), this virtually disappeared in the optimized model, see Figure 5. This demonstrated that NVH issues can not only be detected but also reliably resolved in the digital twin.

This case study clearly illustrates how the NVH optimization process is shifting: away from late-stage test bench trials toward early, simulation-based root cause analysis in the digital twin. With EXCITE M and EMT, critical resonances can be identified, their causes understood, and countermeasures such as HCI optimized directly in the model. For engineers, this means deeper system insights, well-founded decisions early in the process, and significantly less risk during hardware testing. For companies, this translates into a clear competitive advantage: lower development costs, shorter time-to-market, and higher customer satisfaction.
Stay tuned
Don't miss the Simulation blog series. Sign up today and stay informed!
Read More About This Topic
NVH analysis is typically performed after a problem has been identified that needs to be addressed. In the case of a simulation model used, it is advisable to proactively look for increased vibration and resonance so that the model can be optimized before the first prototype is built.
At the upcoming AVL SIMpulse we open the black box of bearing behavior inside the e-motor.
Through the highest fidelity simulation approach our solution enables the accurate prediction of e-drive NVH. It covers the complete workflow from design to acoustics. The simulation runs in time domain which enables the consideration of physical behavior like it is in reality, without the need to simplify (linearize).
Properly considering the excitation of the e-motor is essential when analyzing the NVH of e-drives. Typically, electromagnetic forces on the stator and torque on the rotor are precalculated using electromagnetic tools.
This article is about a technique called Time-Frequency Analysis, which originates from signal processing. In simple words: it provides the frequency content of a signal (or a simulation result) given as a time trace.
Stay tuned for the Simulation Blog
Don't miss the Simulation blog series. Sign up today and stay informed!