Simulation-Driven Design for Mobile Hydrogen Refueling: Increased Efficiency Through System Understanding
Published on September 30, 2025 · 12 min read

The use of hydrogen drives on remote construction sites, in agriculture, or in quarries poses particular challenges. The machines often run for many hours at a time, have high energy requirements, and generally cannot rely on stationary refueling infrastructure. Depending on the size of the operation and the number of vehicles, setting up such infrastructure is often not economical. This makes hydrogen supply complex: reliable and efficient refueling directly on site is essential to ensure operation. Mobile solutions must therefore not only be safe and powerful, but also flexible enough to cope with different operating conditions.
One solution: mobile hydrogen filling stations that enable 700-bar refueling directly on site. But how efficient is such a solution? Which physical processes dominate the refueling process? And how can components be specifically optimized to stay within thermal and mechanical component limits and shorten refueling times?
Answers to these questions are provided by a comprehensive simulation approach that maps the entire system behavior – from the filling station to the vehicle tank.
The structure of the mobile hydrogen filling station examined is shown schematically in Figure 1. The filling station has several 700-bar hydrogen storage tanks that are filled at a stationary filling station. In contrast to pure overflow tank systems, an additional tank is installed that contains a special fluid that does not react with the hydrogen. This fluid is pumped into a hydrogen tank during refueling, allowing the filling station tanks to be emptied almost completely. The power required to drive the pump can be provided either by the vehicle being refueled or by the filling station's carrier vehicle.

The connection to the vehicle is made via a flexible refueling hose and a receptacle. In the vehicle, the hydrogen is fed via a distribution block to the individual tanks, each of which has an on-tank valve.
Both the hydrogen line from the filling station to the vehicle tanks and the pump fluid generate complex pressure, temperature, and mass flow curves, which must be accurately represented in the simulation. The curve of the state variables in the vehicle tank for a refueling process is shown in Figure 2.
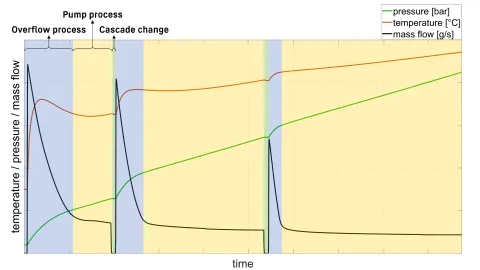
Refueling takes place in a cascade (tank by tank) and in several phases:
1. Overflow (blue): Hydrogen flows from a full filling station tank into the vehicle tank – driven by the pressure difference. This is where the highest mass flow occurs, caused by the initially large pressure difference.
2. Pumping process (yellow): The pressure difference between the filling station and the vehicle is no longer sufficient to maintain the mass flow. Therefore, a fluid is pumped into the partially emptied filling station tank to push out the remaining hydrogen.
3. Cascade change (green): After emptying one tank, the process moves on to the next and the overflow phase begins again. The fluid is transferred via the pump from the previously emptied tank to the next tank to be emptied.
Depending on the initial and operating conditions, the relevant state variables can vary over a very wide range of values, some of which are limited by component constraints and must therefore be identified and covered by the simulation.
- Pressure ranges: 30 to 875 bar
- Temperature ranges: -40°C to +85°C
- Mass flows: up to 200 g/s
- Refueling time: 10–15 minutes
Particular focus was placed on the thermal load on the system. The temperature rise in the vehicle tank—especially during rapid overflow—can lead to critical temperature peaks that stress materials and compromise safety, thus leading to the termination of the process. If these critical temperature peaks are reached before the vehicle tank is completely filled, this also leads to a reduction in range. The refueling time is not a fixed specification, but is determined directly by compliance with component limits in terms of temperature and pressure. The goal is always to reach the desired target pressure before reaching the maximum permissible temperature – and to do so as quickly as possible. This also reveals the potential for further reducing refueling time through optimized strategies.
The components installed in the refueling line influence the aforementioned state variables primarily through their geometry and thus their flow behavior. Two key components were examined in detail due to their complexity in order to more accurately identify their influence on the refueling process:
- Receptacle: The interface between the filling station and the vehicle – represents the vehicle-side counterpart to the fuel nozzle (see Figure 1).
- On-tank valve (OTV): The valve on the vehicle tank – enables hydrogen to be filled and removed (see Figure 1).
Alternative components with improved flow coefficients were investigated. The aim was to answer the following questions, among others:
- How much can refueling time be reduced?
- How does the temperature in the tank system change at the end of refueling?
- Does it drop due to the reduced Joule-Thomson effect?
- Does it rise due to the higher mass flow?
Optimization of the Receptacle
By using a receptacle with an improved flow coefficient (factor 4.5), significant improvements were achieved, as shown in Figure 3.
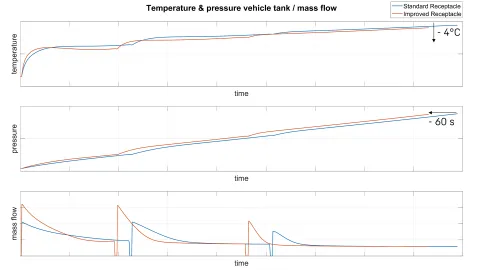
The most important results of the simulation carried out:
- Reduction of refueling time by 60 seconds and simultaneous
- Reduction of the final temperature in the vehicle tank by 4°C
The simulation showed that the receptacle is a significant bottleneck in the system. The higher mass flow rate allows the vehicle tank to be filled to its target pressure more quickly without reaching a critical temperature in the tank, and the final temperature can even be reduced. With pump performance remaining constant, a reduction in refueling time also leads to a reduction in the energy required for refueling. A higher flow coefficient therefore has a significant impact on efficiency and temperature development.
Analysis of the On-Tank Valve
A variant with an improved flow coefficient (factor 1.6) was also investigated for the OTV, based on the system with improved receptacle from the previous analysis. The results are shown in Figure 4.
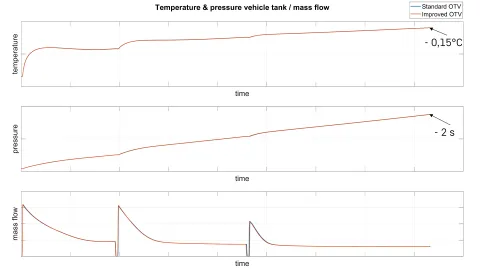
Only minor differences were observed. This means that the adaptation of the OTV in the overall system has a significantly lower impact on the refueling process than the receptacle. This can be attributed primarily to the following reasons:
- Only about one-third of the mass flow passes through the OTV, as it is distributed evenly among the three tanks considered in this example. This results in significantly lower pressure losses than at the receptacle from the outset. In addition, the pressure difference in the standard component is already very low, so that an adjustment here has little influence on the refueling time.
- In contrast to the receptacle, the flow coefficient was not improved by a factor of 4.5, but only by a factor of 1.6.
An often underestimated factor influencing the above-described conditions during hydrogen refueling is the condition of the vehicle tank prior to filling. This depends heavily on the previous use or emptying of the tank and the ambient conditions:
- Sunlight increases the tank temperature, making filling more difficult.
- High consumption prior to refueling cools the tank, making filling easier.
Assuming classic single-shift operation, the time of day influences the ambient conditions:
- Morning: low outside temperature, long overnight standby time and thus equalization of tank and outside temperatures
- Noon: moderate outside temperature, but previous consumption has a cooling effect on the tank
- Afternoon: high outside temperature, but also cooling of the tank through use
Fleet data from conventional machines can be used to simulate these influences and determine the initial state before refueling. Figure 5 shows the results for daily refueling at 12:00 noon as an example. Hydrogen consumption, downtimes, and environmental conditions for a large number of machines and working days were taken into account. The figure shows the frequency of the different initial states before refueling.
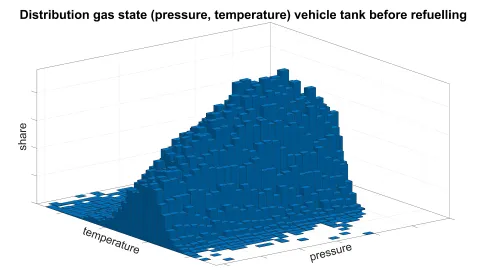
There is a very strong variance in starting temperature and pressure, which will subsequently lead to differences in the refueling process and final state. The aim is to identify the starting conditions of temperature and pressure under which certain state variables exceed their limits or the refueling time must be extended. In addition, fleet analysis allows probabilities to be determined as to when a refueling process meets the requirements for temperature, pressure, and time and when it does not. The simulation makes it possible to systematically and automatically calculate this multitude of initial states and present them in a suitable manner.
The analyses presented were based on the CRUISE M simulation tool—a modular, multidisciplinary platform for modeling complex energy systems. The software made it possible to map the entire mobile hydrogen refueling system as a consistent thermodynamic model—including all relevant components such as:
- Hydrogen tank (700 bar)
- Fluid tank and pump
- Receptacle and on-tank valve
- Vehicle tank with realistic operating conditions
Thanks to its flexible model structure, CRUISE M can be used to efficiently analyze a wide variety of scenarios—from standard refueling to variants with modified components or initial conditions, as well as different refueling procedures or strategies.
Advantages of Simulating With AVL CRUISE™ M
- Rapid iteration: Changes to components or operating parameters could be implemented and analyzed directly in the model.
- Thermodynamic depth: The precise mapping of pressure, temperature, and mass flow curves as a function of the hydrogen medium used and its real gas behavior enabled a well-founded assessment of system efficiency.
- Integration of real data: Fleet and environmental data could be incorporated directly into the simulation to model realistic initial conditions.
- Validation of design and concept decisions: The effects of component variations (e.g., receptacle with higher flow) could be quantified and compared with existing solutions.
Mobile hydrogen refueling places high demands on technology, safety, and efficiency. Simulation-based development with CRUISE M allows these challenges to be identified and solved in a targeted manner. The methodology presented shows:
- Receptacle as the dominant bottleneck: Optimizing this interface yields the greatest efficiency gains.
- Simulation replaces costly field tests: Many scenarios can be modeled virtually—faster, safer, and more cost-effectively.
- Initial conditions are crucial: Taking real operating conditions into account is essential for a practical design.
Stay tuned
Don't miss the Simulation blog series. Sign up today and stay informed!
Read More About This Topic

As PEM fuel cells move to the forefront of heavy-duty transportation and aviation, development teams are under growing pressure to deliver systems that meet ambitious performance, durability, and efficiency targets.
Stay tuned for the Simulation Blog
Don't miss the Simulation blog series. Sign up today and stay informed!