

Optimizing Design to Reduce the Impact of Sloshing in a Tanker Truck with PreonLab 6.2
Published on April 02, 2025 · 4 min read

When external forces act on a partially filled container, the liquid inside may start to slosh due to inertia. In the automotive industry this is commonly observed in fuel tanks or liquid transportation systems. In these cases, sloshing is typically induced by vehicle acceleration and deceleration, wheel-road interaction over uneven surfaces, slope change along the road, cornering or even engine vibrations.
Unrestrained sloshing can lead to excessive force and pressure fluctuations within the tank walls, as the liquid sways and splashes within the container. Over time, this contributes to unwanted stress, and to wearing down the entire structure and components like the mounting points between the tank and trailer quicker. Furthermore, in vehicles, ships and aircrafts, uncontrolled sloshing can lead to shifts of the center of mass and can have detrimental effects on the handling and control, depending on the amount of fluid and magnitude of sloshing. Consequently, understanding sloshing is crucial while designing fuel tanks and large liquid containers, and subsequently using baffles and dampers to dissipate kinetic energy and reduce force and pressure fluctuations.
Simulating with PreonLab is fast and efficient. But what does this exactly mean?
PreonLab is a mesh-free software, which means that unlike traditional CFD methods, there is no need for complex meshing, reducing both general simulation set up times as well as the barrier to entry for new users. Additionally, PreonLab offers an intuitive UI and the possibility to perform multiple simulation iterations with the help of automation tools like the python-based API - PreonPy. This ensures leans workflows, that can be scaled from a single simulation to analyzing multiple design variations and performing parameter studies.
PreonLab is also computationally fast. At its core, the PreonSolver combines the numerical robustness of grid-based methods with the intrinsic advantages of mesh-free approaches and allows for large timesteps (CFL 1) during simulation. Furthermore, capabilities like adaptive time-stepping ensure that the timestep is dynamically adjusted to maintain stability while improving efficiency. The software is optimized for large-scale fluid simulations with adaptive resolution, reducing unnecessary computations and offers multi-GPU & MPI support to leverage parallel computing for faster processing.
Of course, fast results alone are not enough. Simulations must be accurate and capable of capturing a wide range of vehicle and fluid dynamics phenomena, which calls for the right tools capable of multiphysics simulation.
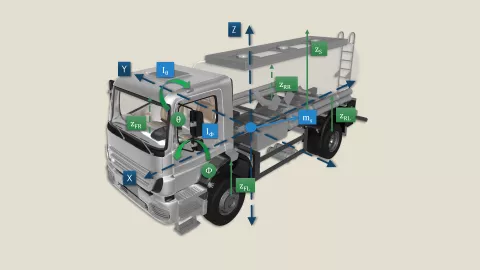
PreonLab includes the Full Car Suspension Model (FCSM), which makes it possible to account for spring deflections of the truck based on applied forces to reposition sprung parts relative to unsprung parts like wheels. Deflection forces are calculated for each wheel individually, factoring in fluid forces, acceleration, deceleration, weight shift, and road interactions. Figure 1 visualizes a simplified model of the various deflections and rotations currently allowed by FCSM. These include vertical deflections for each wheel, as well as vertical deflection and rotation due to moments of inertia about the pitch and roll axes for the sprung mass.
As a result, it is possible to perform precise simulations that include the impact of driving over uneven terrain, slopes, banked roads, and even potholes, as shown in Video 1. This not only facilitates detailed simulation for a large range of scenarios but also helps to gain a comprehensive understanding about the impact of design changes on the suspension system. No additional software or licenses are required to use FCSM with PreonLab, ensuring seamless integration into the simulation workflow.
Video 1: Tanker Truck driving over dry potholes using FCSM.
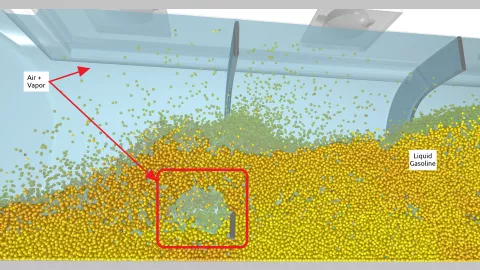
Experience has shown that while single phase simulations can be quite useful and fast when it comes to tank sloshing simulations, multiphase simulations are more beneficial when it comes to analyzing broader aspects of the sloshing impact accurately. Hence, the simulations discussed in this article are performed as multiphase simulations, i.e. by considering the mixture of gasoline vapor and air as a gaseous phase within the container in addition to the liquid gasoline phase. This can be particularly beneficial to simulate high magnitude sloshing behavior and observe phenomena such as gas entrapment in the liquid, as is shown in figure 2. Although the density ratio in the case of gasoline and a mixture of gasoline vapor and air is notably high (in the order of 10^3), PreonLab’s Continuous Surface Stress (CSS) model for surface tension can be used to successfully perform the simulation.
In the following, we shall explore the tank sloshing phenomena for three different tank designs.
Note: The truck and tank geometries used in these simulations are representative geometries that have been used for demonstration purposes.
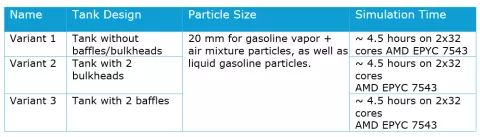
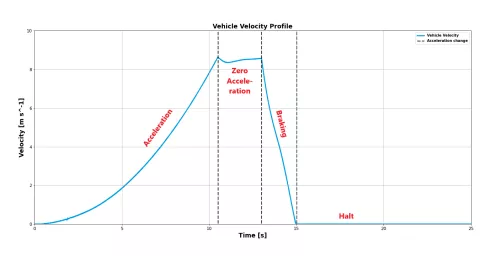
For all three variants that are listed in Table 1, the simulation is performed for 25 seconds of physical time with identical simulation settings with differences only in the tank design. The truck trajectory and suspension properties are described in FCSM as inputs. For these simulations, the trajectory has been defined as an acceleration profile for all three variants. The trajectory is divided into four different phases, as can be seen in Figure 3.
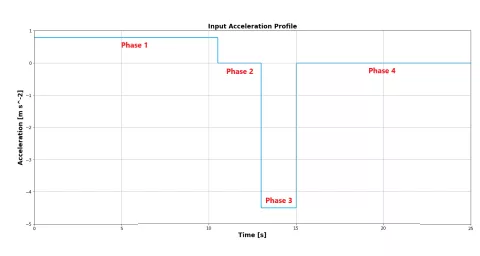
Initially, the truck accelerates at 0.8 m/s^2 in the first 10.5 seconds and then the acceleration is set to zero so that the truck travels at a relatively constant velocity for 2.5 seconds. In phase three, the truck is decelerated at 4.25 m/s^2 to simulate braking and make the truck come to a halt within 2 seconds. In phase four, i.e. once the truck has come to a halt, it is not accelerated or decelerated further. The resulting velocity profile is shown in Figure 4. The truck gradually accelerates to a speed of 8.5 m/s in the first phase, before maintaining an approximately constant velocity of 8.5 m/s for 2.5 seconds.
Finally, the truck is sharply decelerated for 2 seconds after which it comes to a halt. It can be observed that the velocity is not entirely constant in the second phase. Additionally, the velocity profile during acceleration and braking is not exactly linear. This is because FCSM can account for fluid sloshing forces inside the tank in addition to the pre-defined acceleration profile. The fluctuations in sloshing force, which arise from changes in acceleration, have a noticeable impact on the truck’s speed profile and handling.
As listed in Table 1, the three variants differ in design due to the usage of bulkheads or baffles. The tank design in variant 1 does not have any baffles or bulkheads to dissipate the uni-directional fluid movement through the entire tank. Variant 2 uses two bulkhead geometries, dividing the tank into three smaller zones. Typically, this should lead to a damping of the fluid flow and reduction of excessive force and pressure fluctuations over the entire tank, along with an increased sloshing frequency due to the smaller distance between the walls. Finally, variant 3 is simulated with two baffles in place of the bulkheads. As a result, the fluid in the tank is not isolated into one of the three zones and can move between the zones. However, the flow of fluid is still disrupted by the baffles, and forces can be dissipated during the resulting chaotic movement in contrast to the unidirectional fluid movement along the length of the tank.
The used bulkhead and baffle geometry is shown in Figure 5.

Simulation Results
The simulation results have been visualized in videos 2, 3, and 4, for variants 1, 2, and 3, respectively. The liquid gasoline is rendered as a yellowish-golden fluid and the air and gasoline vapor mixture is rendered as a translucent yellow fluid. Additionally, some key statistics have been analyzed to draw some conclusions pertaining to the design differences in the three variants.
- Total Longitudinal Force Acting on the Tank Components
One of the most interesting results that can be analyzed to understand the sloshing that occurs in each of the three variants is the total force acting on the tank and its components due to the sloshing fluid. Figure 6 plots the total longitudinal force acting on the tank and its components due to sloshing for the three simulation variants. Positive values of force signify force being exerted in the positive x-direction i.e. in the travel direction, while negative values signify forces acting in the reverse direction.
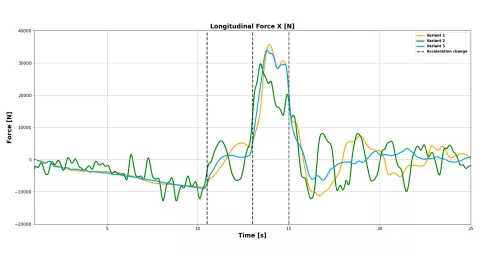
The magnitude of the force is similar for all three variants. However, a higher number of oscillations can be observed in the curve for variant 2. In all three cases, an increase in the total force can be observed around 10.5 seconds and 13 seconds, i.e. when the trucks’ acceleration profile changes significantly. During braking between 13 seconds and 15seconds, the curve for variant 2 shows a lower peak compared to the other variants. After around 15 seconds of the simulation, oscillations in the magnitude of the force are clearly visible for variants 1 and 2. Although the truck has come to a halt due to the drastic braking, gasoline continues to slosh within the tank leading to these force fluctuations. The frequency of oscillations is highest in the design including bulkheads. In contrast, the curve for variant 3 is much smoother, which corresponds to the reduced sloshing in the tank compared to the other variants because of the baffles. This can also be seen in Video 4. As a result, it can be inferred that while the use of bulkheads can lead to relatively lower peak values for the total force, the use of baffles within the tank leads to a reduction of sloshing force fluctuations acting on the tank.
- Impact of Sloshing on Wheel Deflections
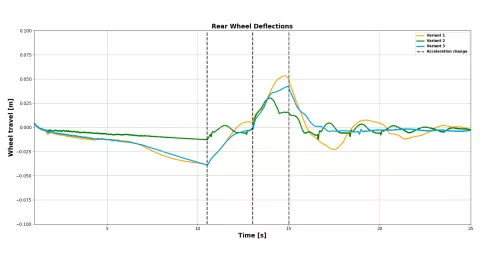
Another important aspect is the impact of sloshing on the wheel spring forces and the resulting wheel deflections. These are shown in Figure 7a for the front right wheel and Figure 7b for the rear right wheel.
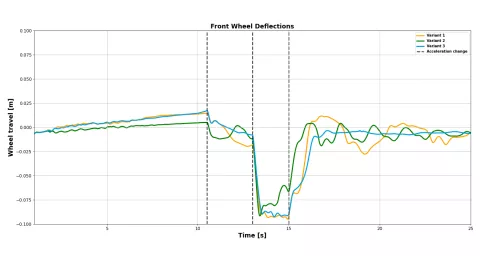
During the acceleration phase, variant 2 shows the least absolute deflection per wheel, while the deflections for variants 1 and 3 are very similar. This can be explained by the fact that in variant 1, the fluid is confined in the three individual chambers due to the two bulkheads. As a result, the total center of gravity of the fluid does not shift as much to the rear as in the other two variants. This leads to a more constant weight distribution, resulting in lower wheel deflections.
After 15 seconds, when the truck has come to a halt and gasoline continues to slosh within the tank, oscillations in the wheel deflections can be observed for variant 1 and variant 2, exactly as it was observed in the case of the total longitudinal sloshing force. The frequency of oscillations is higher for variant 2 i.e. the design with bulkheads, while the magnitude of the oscillation is higher for variant 1. Again, in contrast to these two variants, the wheel deflections curve is much smoother for variant 3, i.e. for the design using baffles.
Consequently, it can be inferred that the use of baffles within the tank proves to be beneficial in this regard, too.
- Visualizing the Fluid Velocity
One of the strengths of virtually analyzing such sloshing phenomena is the different types of analyses that can be performed during post-processing. Not only is it possible to analyze statistics like forces, pressures, and wheel deflections, but it is also possible to visualize details of the fluid flow like the fluid velocity. The Videos 5, 6, and 7 show the fluid velocity in the positive x-direction for each of the three variants. Additionally, it is also possible to visualize the particle trajectory with the help of pathlines in PreonLab. Pathlines help to visualize the path traveled by individual particles over time and can be colored based on the velocity magnitude. Users can specify particles that should be tracked, by defining a time range and a spatial region. Additionally, the region can be specified based on its proximity to a particular geometric surface within the simulation. In video 8, pathlines have been generated for some particles around the second baffle in variant 3 and visualized for the braking phase of the simulation with the help of the Pathlines Sensor in PreonLab.
Video 8: Video visualizing the fluid flow around 1 of the baffles in variant 3 using the Pathlines Sensor in PreonLab.
Using PreonLab 6.2, it is possible to perform multiphase tank sloshing simulations that include spring deflections of the vehicle due to acceleration and deceleration, as well as the impact of sloshing forces on the suspension using FCSM. The simulations can be performed very quickly and do not require additional pre-processing time due to PreonLab’s mesh-free approach. It is possible to gain comprehensive insights regarding a wide range of statistics pertaining to fluid behavior and vehicle suspension that might be of interest with the help of easy-to-use post-processing tools. In this article, the simulated sloshing phenomena for three tank design variants has been visualized, and the longitudinal sloshing forces on the tank as well as the wheel deflections for the truck have been analyzed. For the three design variants considered in this demonstration, the tank design with baffles proves to be the most beneficial when it comes to reducing force fluctuations in the tank as well as lowering oscillations in wheel deflections after the truck has come to a brisk halt.
Stay tuned
Don't miss the Simulation blog series. Sign up today and stay informed!
Read More About This Topic
Vehicle water management is a critical component of design, which traditionally has heavily relied on costly physical testing. Whereas conventional CFD is hardly applicable due to underlying modeling complexity and extremely high computational costs, SPH technology has virtually revolutionized water management simulation.
Stay tuned for the Simulation Blog
Subscribe and don‘t miss new posts.