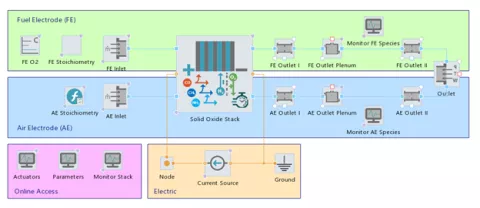
The 3D stack model has set a milestone on the system level. The three-dimensional representation allows you to study the impact of spatial non-uniformities on stack performance characteristics without having to perform extensive CFD simulations.
The PEM Fuel Cell (PEMFC) models and the Solid Oxide Fuel Cell and Electrolyzer (SOxC) components in CRUISE M have been extended to fully reflect the stack behavior in 3D. You can configure spatial resolution in all three dimensions: Select between straight or serpentine gas channels and choose between parallel or crossflow as the flow type. Non-uniform inlet flow conditions are handled using dedicated input maps covering the two dimensions of the cathode and anode inlet face, respectively. The thermal 3D stack model can be connected to CRUISE M's liquid and gas networks in a freely configurable way to describe any kind of stack thermoregulation. Result analysis is supported by full 3D postprocessing, by dedicated 2D cuts, and by time-based data at user-defined measurement positions.
The measured CPU times for representative model sizes, i.e. number of segments used for spatial discretization, show real-time factors in the range between 0.25 (50 segments) to 3 (600 segments).
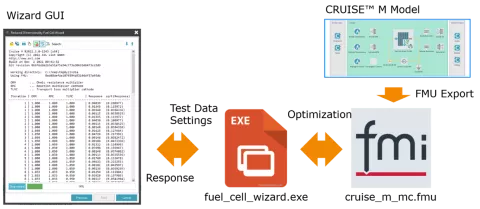
The PEM Fuel Cell Model (PEMFC) Generator, first released in CRUISE M 2022R1, has been extended to support the parameterization of the stack model based on measurement data with the help of built-in optimization techniques. In this version of CRUISE M, not only the stack component is automatically generated but also all the infrastructure components needed to run the model. This involves a closed electrical circuit, gas networks for the anode and cathode supply, control functions to operate the plant, the measurement data used for the parameterization and tailored dashboards for online monitoring and result postprocessing. At the end of this process, a stack component model is available for further use featuring the optimized model parameters representing the reference data with highest accuracy. Having gone through the Fuel Cell Model Generator, you need to do nothing more than click “Run”.
When operating Solid Oxide Fuel Cell (SOFC) systems with liquid fuels such as methanol and ethanol, the fuels must be vaporized before being supplied to the SOFC stack. The evaporation and condensation of liquid species into and from a gas phase is now supported by CRUISE M.
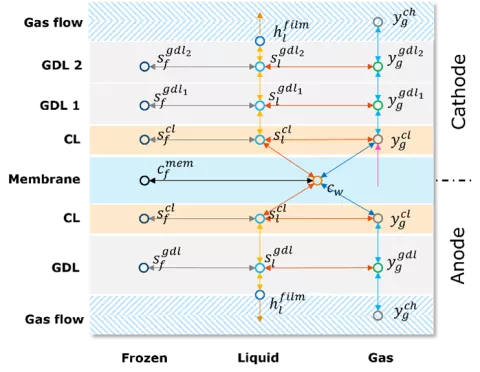
You can now choose between the five gas path components: Plenum, Quasi Dimensional Pipe, Restriction, Gas Heat Exchanger and Gas Flow Loss. Optionally, CRUISE M offers the possibility to configure a dedicated liquid film that interacts with the gas flow. The film model takes into account convective heat exchange with the gas, conductive heat transfer to the underlying wall, and the latent heat consumed/released during evaporation/condensation. All required liquid properties are provided by the property database. The film mass may additionally change due to trapping of liquid droplets from the gas stream or release of droplets due to the carry away effects. Heat transfers and evaporation/condensation follow fundamental physical considerations that are influenced by the selected liquid properties and flow conditions. It is worth mentioning that trapping and carry away effects are modeled in an empirical way.
There have also been new developments related to AVL FIRE™ M.
The existing PEM Fuel Cell Degradation Models in our CFD tool AVL FIRE™ M have been extended with an additional chemical degradation effect. This release of FIRE M allows you to simulate the formation of a platinum band in the polymer electrolyte membrane. The formation of the Pt band is actually the result of an undesirable effect, namely the loss of Pt in the catalyst layer of the cathode. However, the band formation also has a positive effect. The consumption of hydrogen in the membrane by the platinum band protects the cathode catalyst layer from a larger amount of hydrogen cross-over, thus reducing the effects of parasitic reactions.
In detail, the platinum ions generated in the cathode catalyst layer by dissolution of the metallic platinum diffuse into the membrane, where they react with crossover hydrogen coming from the anode to form solid platinum crystallite. This leads to the formation of a catalytic surface inside the membrane called a platinum band. The location and size of the platinum band is determined by local operating conditions such as temperature, potential or concentrations. Beside the reaction between platinum ions and hydrogen, additional reactions occur at the new catalyst surface, for example oxygen and hydrogen reduction, hydrogen peroxide reduction and Pt-dissolution.
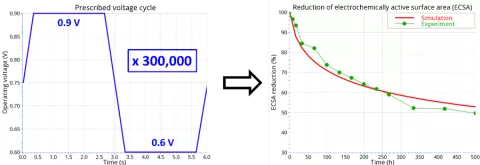
Combined with the existing catalyst layer and membrane degradation models available in FIRE M, you can analyze in spatial and temporal details the reduction of the electrochemically active surface area (ECSA) that leads to a loss of fuel cell performance over time. Thanks to the unique numerical methods in FIRE M, you can efficiently simulate, for example, the impact of multiple voltage cycles of accelerated-stress-tests, covering several hundred hours of operation, on the performance evolution of the PEM fuel cell.
The Fuel Cell Module in FIRE M now offers you a model for the simulation of low-temperature PEM hydrogen compressors.
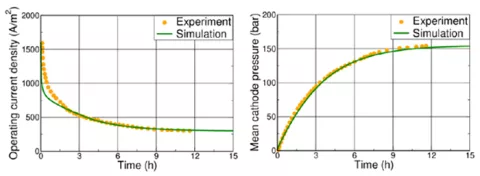
In an electrochemical hydrogen compressor (EHC), hydrogen is continuously produced by supplying electrical energy in a closed system. The process runs until the desired pressure, max. up to 700 bar, is reached. Compared to conventional mechanical hydrogen compression, an EHC has a number of advantages. These include higher efficiency, noiseless operation and robustness.
Design: The EHC is a combination of a PEM electrolyzer and a PEM fuel cell. Like the PEM fuel cell, hydrogen is oxidized at the anode side, producing hydrogen protons and electrons, and similar to a PEM electrolyzer, hydrogen is produced at the cathode side by recombining hydrogen protons and electrons. The materials of an EHC are basically the same as for a PEM fuel cell.
You can use the new EHC model in both transient and steady run mode. You will gain insights into the mass and heat transport and electrochemical processes, allowing you to determine the impact of hardware design features, membrane and GDL material properties, and operating conditions on performance and efficiency.