
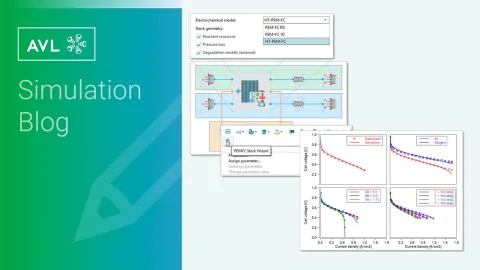
High Temperature PEM Fuel Cell Model in AVL CRUISE™ M
Published on January 14, 2025 · 9 min read
In the Release 2024 R1, CRUISE M offers a dedicated model for HT-PEM in the well-established PEM Fuel Cell Stack component. Therewith, it inherits all the basic features and benefits of CRUISE M’s multi-domain, multi-scale stack modeling approach. The electrochemical model considers the formulation of the Nernst equation and the activation loss based on the Butler-Volmer equation, as well as the calculation of ohmic and transport losses. We will revisit these individual phenomena later in the text. A dedicated reactant crossover model completes the picture.
Between you and me, modeling HT-PEMs in some regards even simplifies matters compared to LT-PEMs by excluding complex phenomena that are difficult to parameterize, such as transient membrane water uptake and the formation and removal of liquid water. The absence of membrane humidification effects sheds light on the electrochemical model behavior and its sensitivity to changing boundary conditions. During the development and validation of the model, we identified several electrochemical model constants to raise the prediction accuracy for HT-PEM systems – thereby enhancing the corresponding models for LT-PEM fuel cells and electrolyzers as well. You can verify this in the next section.
The HT-PEM model is validated with data from literature, which comprises steady-state polarization curves at different temperatures, feed gas concentrations and feed mass flow rates. The comprehensive dataset enables the electrochemical engineer to investigate the primary relevant loss contributions, including ohmic, activation, and transport losses.
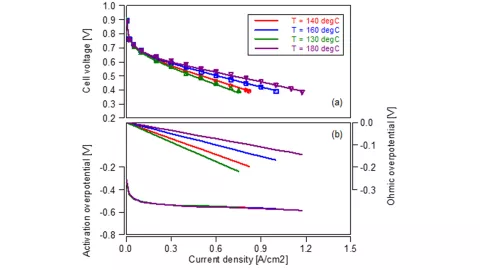
Let’s start by looking at one of the main operating parameters: the stack temperature. The reference data holds four polarization curves at temperatures ranging from 130 to 180 °C. Figure 1a shows a comparison between the experiment (dots) and simulation (lines) for the cell voltage, which are in good agreement. The higher the temperature the better the stack efficiency. Do you wonder what’s the root cause for this trend? The virtual twin allows to look into this as it gives a more detailed analysis of the individual loss contributions, which is shown in the Figure 1b. The activation overpotential (bottom lines) is similar for all temperatures, while the main difference is seen in the ohmic losses. In general, they increase linear with the current density. Their gradient, the ohmic resistance, is smaller the higher the stack temperature. In the model, this trend is given by the temperature dependent ionic conductivity, which is defined via SDT’s property database.
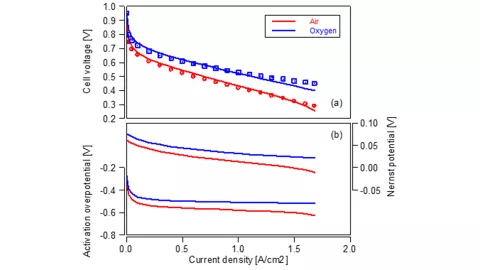
What happens when the stack is operated with pure oxygen instead of air as cathode feed gas? Thanks to the fact that the electrochemical model considers the reactant concentrations in the Nernst voltage and in the Butler-Volmer equation it is possible to simulate such a scenario. The corresponding results are shown and compared to measurements in Figure 2a. The loss analysis in the Figure 2b exhibits the individual contributions. The ohmic resistance is identical for both curves and therefore not shown. Both, the Nernst voltage loss, and the activation loss are reduced for the higher reactant concentration. This determines the cell voltage behavior given in the measurements, which is well reflected in the model.
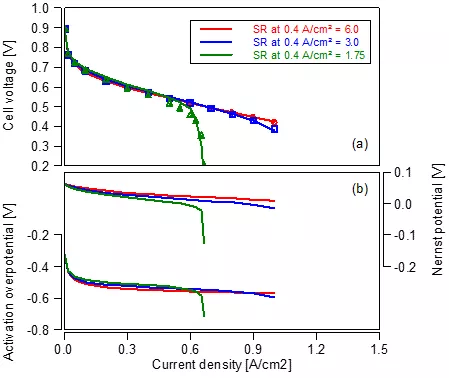
Ohmic loss – check! Activation loss – check! What about transport loss? For this purpose, we investigate a variation of the air feed, which features a constant mass flow rate for each polarization curve defined via the stoichiometric ratio at a current density of 0.4 A/cm². The results are shown in Figure 3. For the high (red) and medium (blue) flow rate, sufficient reactants are supplied to the system. Only a minor voltage drop is observed at high current densities with the medium flow rate. For the lowest flow rate (green) current density limitation due to reactant starvation is observed in the measurements, which is well reflected in the model.
The results quality shown in the previous section can only be achieved by considerable time and effort – or by using an automatic workflow such as the parameterization wizard in CRUISE M. For the HT-PEM model development and validation we chose the latter. It came in handy that the wizard workflow was significantly revised in 2024 R1. The following video targets simulation engineers who are already familiar with the workflow and introduces the most important enhancements.
High-temperature PEM fuel cells are an interesting alternative to conventional low-temperature fuel cells. They operate at temperatures up to 200 °C and are known to be less sensitive to impurities of the supplied hydrogen. CRUISE M addresses this technology with a new HT-PEMFC model. With the help of the automatic parameterization wizard, the model is validated for a variety of operating conditions including different temperatures, feed gas concentrations and feed mass flow ratios, which exhibits an excellent agreement.
Stay tuned
Don't miss the Simulation blog series. Sign up today and stay informed!
Learn More About This Topic

With the demand for non-fossil energy, solid oxide fuel cell systems and electrolyzers have taken their place in stationary power generation. Their advantage is obvious: They are local, well-scalable and highly efficient systems.
To develop a truly efficient and durable polymer electrolyte fuel cell (PEM) system , engineers must have insight into the basis of the system - the cell. The transport of hydrogen and oxygen, the electrochemical reaction processes, the membrane structure, the aging mechanisms, the supply of each cell in the fuel cell stack, and much more are ...

Data gives one the confidence to clearly decide which concepts to follow. A solid data basis is especially important when mobility concepts are evaluated with regard to multiple factors at the same time. This is exactly what AVL CRUISE™ M stands for.
Stay tuned for the Simulation Blog
Subscribe and don‘t miss new posts.