Loss of Active Material Simulation with the Electrochemical Battery Model in AVL CRUISE™ M
Published on March 11, 2025 · 9 min read
In the automotive industry, LIBs face several degradation mechanisms that impact lifespan but also safety. In a simplistic way, we can categorize them in three modes:
- Conductivity Loss (CL)
This happens when the ability of materials to conduct lithium ions and electrons decreases, leading to a higher internal resistance. Such degradation can be caused by binder decomposition, lithium dendrites formation and changes in the porosity for example.
- Loss of Lithium Inventory (LLI)
This occurs when lithium ions are consumed by side reactions, such as the formation of a Solid Electrolyte Interphase (SEI) layer on the anode or the growth of the Cathodic Electrolyte Interphase (CEI) film on the positive electrode. Such reactions reduce the overall amount of lithium available for the battery operation.
- Loss of Active Materials (LAM)
This refers to the reduction in the amount of electrode active material available for intercalation/deintercalation. Physical degradation of electrode materials, such as dissolution or cracking/fracturing due to mechanical stress, is at the base of this degradation mode.
In this article we focus on LAM, exploring what AVL CRUISE™ M's Electrochemical Battery Model (ECB) offers in this regard.
Before discussing about some simulation results, it is important to remark that the LIB aging is a complex topic and, still, not entirely understood. Nevertheless, researchers agree on LAM playing a significant role in the capacity and power fade of LIBs and having just a rough model is much better than having no model at all.
CRUISE M 2024 R2 release supports you with two different LAM models. Let´s have a look at them individually:
Mechanical stress degradation
During charge and discharge cycles, the electrode materials undergo expansion and contraction. Because of cell breathing, the contact points of the particles, fixed by binder materials, suffer periodic mechanical stress. This can result in the cracking and fracturing of the contact points, causing particle to lose contact as they become disconnected from the conductive active matrix (electrically inactive). Not participating anymore in the intercalation/deintercalation process, this active material is irreversibly lost. The model follows the Wöhler fatigue theory and can be applied both to the negative as well as to the positive electrode.
Cathode dissolution
In some cathode materials, transition metals can dissolve into the electrolyte. Especially at high potentials, for example due to acid attack by hydrofluoric acid, this is most likely to happen. That active material is irreversibly lost. The model is relevant only for the positive electrode.
To accelerate aging mechanisms, it is also possible to define an initial amount of active material lost both for anode and cathode. As shown in Figure 1, each above mentioned model can be activated ticking a check box on the ECB Loss of Active Material page.
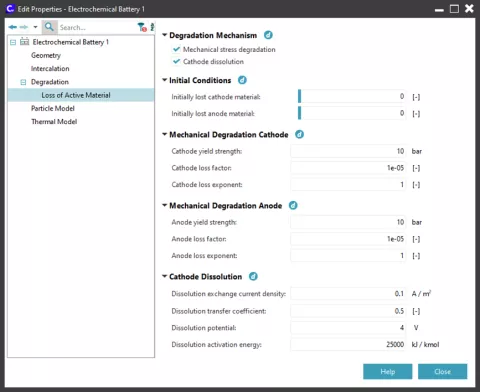
LAM model simulation results
Any simulation method isn't useful unless we have some measurements showing that the phenomenon is important. So, let’s see first what experimentalists do to figure out LAM and then check how ECB LAM models can be useful.
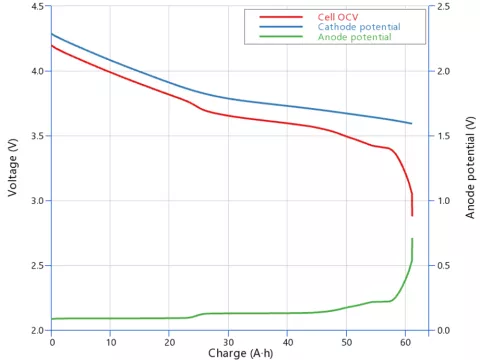
The Open Circuit Voltage (OCV) as function of charge is a KPI graph and is determined only by the electrode material properties and their initial conditions. As it results from the difference between cathode and anode Open Circuit Potential (OCP), it features characteristics of both contributions like a typical step at around 50% charge when using graphite based anodes (see Figure 2).
With aging, the OCV curve changes, and the maximum capacity at cutoff voltage is reduced. As shown in Figure 3, LLI and LAM cause the OCV curve to contract toward left, reducing the available capacity, and to lower the voltage level for the same charge operating point, causing power fade.
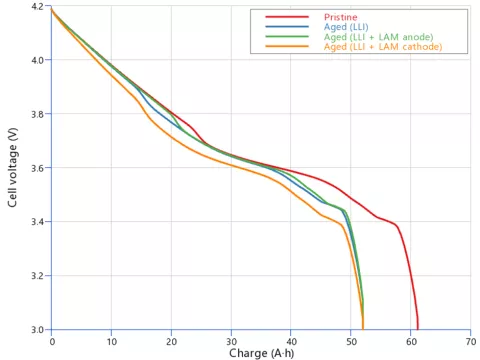
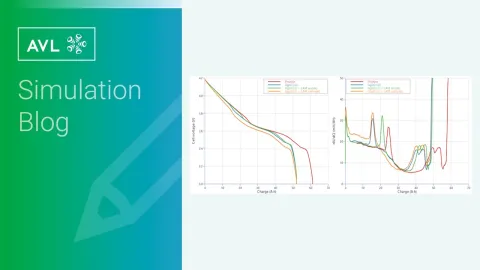
That's not all, the OCV curve holds additional information. The three aged cells in Figure 3 all have the same reduced capacity of about 52 Ah, though the voltage steps originating from the graphite potential are located at different spots. This is even more evident when examining the differential signal (dV/dQ) in Figure 4. Clearly, the peaks position and magnitude change depending on the loss mode.
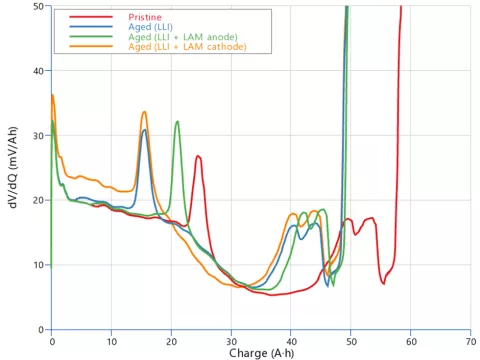
These differential quantities (dV/dQ or dQ/dV) are the smoking gun for experimentalists to figure out, whether there is LAM or not. However, for real batteries, to get graphs as clear as the one in Figure 4 requires numerous cycles interspersed with a full discharge at a very low current, used to extract the differential signal. In other words, this takes plenty of time and time goes usually hand in hand with money.
CRUISE M helps shortening this time, allowing you to simulate with an initial amount of active material lost. All figures so far have been obtained defining proper initial settings of an aged cell, for example.
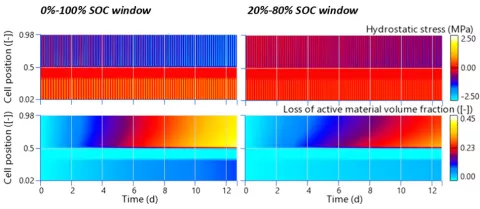
Besides simulating the performance of an aged cell, the LAM feature, with its physics-based background, can explain trends observed in real measurements. Everyone should know that avoiding extremely low/high charge levels helps batteries last longer and perform better. Referring to Figures 5 and 6, the mechanical stress degradation model results point out that the anode LAM volume fraction strongly depends on the State of Charge (SOC) window. For the cell in question, the battery will age faster if you repeatedly charge and discharge it between 70%-90% SOC, compared to the 40%-60% SOC range, as shown in Figure 5.
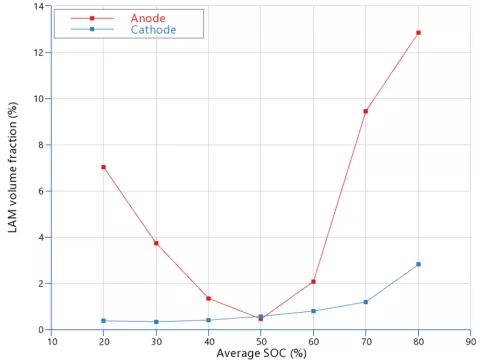

Figure 6 confirms that not reaching SOC extremes while cycling the battery reduces the mechanical stress on the electrodes, indirectly minimizing the loss of active material over the same operating time.
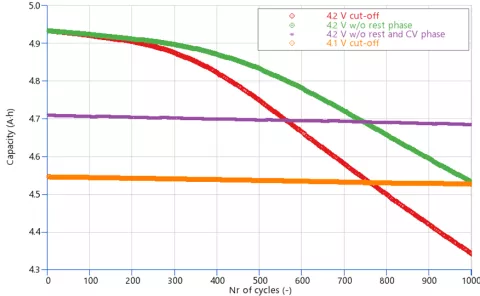
The cathode dissolution model helps in getting an insight on LAM that occurs when a certain voltage level is exceeded. In Figure 7, you can see the cell capacity evolution over 1000 charge-discharge cycles, simulated with different boundary conditions. While the cut-off voltage is the most critical factor, the graph also shows that not resting the cell after each charge and discharge, or skipping the constant voltage phase during charging, can help reducing the capacity fade. Besides the shorter simulation time, the capacity degradation rate is smaller without rest and constant voltage phases because the cell voltage is kept lower during charging, resulting in less time spent at high potentials.
Understanding and mitigating the LAM is crucial for enhancing the lifespan and performance of LIBs. The CRUISE M ECB model provides valuable insights and tools to address battery degradation mechanisms effectively. By simulating mechanical stress degradation and cathode dissolution, the model helps optimize battery cycling conditions.
Stay tuned
Don't miss the Simulation blog series. Sign up today and stay informed!
Learn More About This Topic
Stay tuned for the Simulation Blog
Subscribe and don‘t miss new posts.
